BOFIT Weekly Review 30/2026
China’s GDP growth slows in second quarter
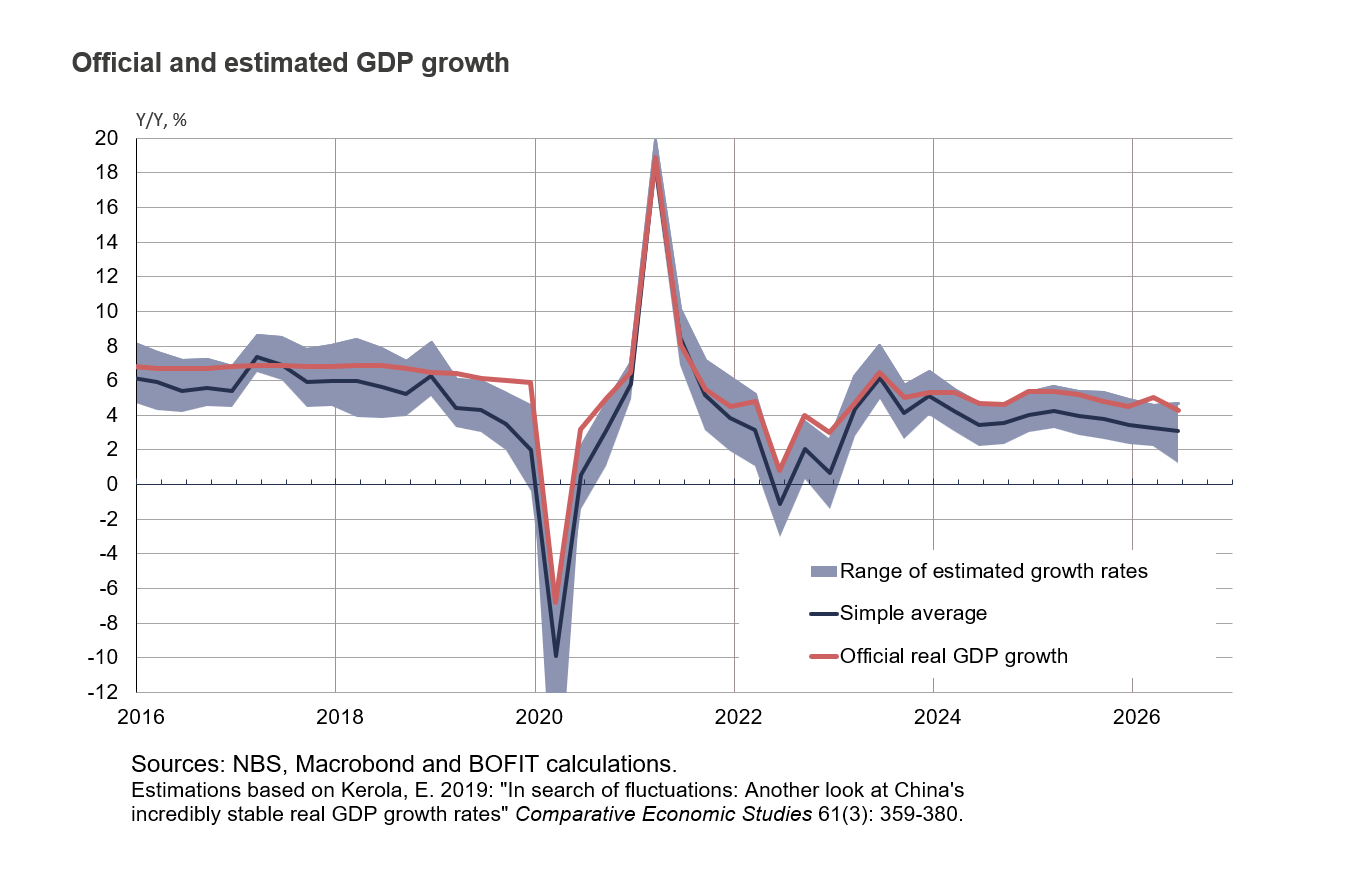
Official figures show the Chinese economy grew by 4.3 % y-o-y in the second quarter of this year (up 3.6 % q-o-q annually adjusted), missing China’s official 4.5–5 % target range for the year. Weak household demand and lower fixed investment reduced growth from 5 % y-o-y in the first quarter (up 5.3 % q-o-q). BOFIT’s alternative GDP calculations indicate Q2 growth slowed to 3.1 % y-o-y (3.2 % in 1Q). Our estimated alternative GDP growth rate band also widened considerably (1.2–4.7 %). The IMF’s updated World Economic Outlook released earlier this month raised its Chinese GDP growth forecast for 2026 by 0.2 percentage points to 4.6 %, and by 0.1 percentage points to 4.1 % for 2027.
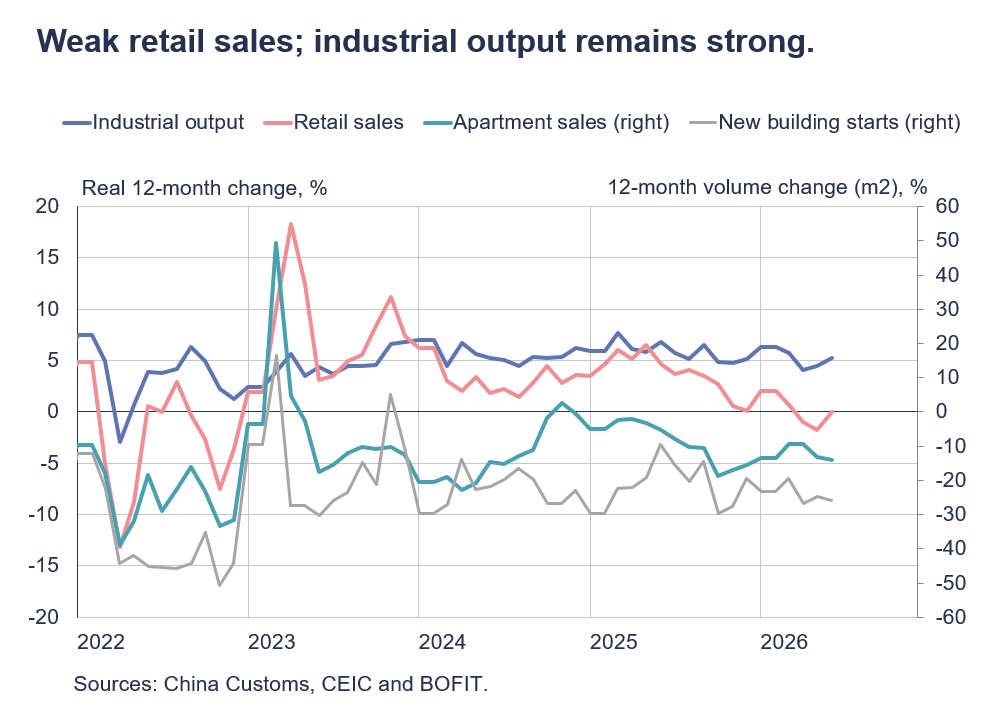
After contracting in May, June retail sales grew by 1 % y-o-y in nominal terms. Estimated real growth was close to zero. Industrial output growth remained strong in June (up 5.3 % y-o-y), suggesting that China increasingly relies on foreign demand as an engine of economic growth. Details on fixed investment trends are conflicted. GDP figures show fixed capital investment accounted for 1.5 percentage points of real growth of the economy overall, while monthly figures for fixed asset investment indicate contraction in nominal terms during 1H26. Nominal fixed investment growth for January-June fell by roughly about 5.3 % y-o-y, and was down by more than 9 % in June. Construction investment growth showed a large decline, with first-half nominal investment in construction and installation down by 8 %. Investments in equipment, however, increased by 8 %. Some of this surprising figure likely reflects the fact that the official investment figure includes changes in inventories. Chinese firms often increase their inventories in periods of weak demand, so some of the contribution to fixed investment growth probably indicates inventory-building rather than investment in production. The June 51.7 reading for Chinese industrial output based on S&P Global’s compiled manufacturing purchasing managers’ index (PMI) was almost unchanged from May (51.8) and still in positive territory. The S&P services PMI softened slightly in June to 54.1 (54.4 in May).
Lifted by demand from the AI boom, the value of Chinese exports in June rose by 27 % y-o-y to €362 billion. While the value of microchip exports in June was up 120 % y-o-y, the export volume rose by just 5.1 %. At the same time, the value of imports grew by 36 % y-o-y to around €251 billion. In value terms, imports of microchips rose by 72 % and data processing equipment by 160 %). The volume of China’s iron ore imports rose by 6.4 % y-o-y (up 18 % by value). The volume of copper ore & concentrate imports fell by 0.6 % y-o-y, but was up by 34 % in value terms. The volume of crude oil imports fell by 41 % in response to the spike in oil prices caused by the closing of the Strait of Hormuz. China has substantial crude oil inventories that it can dip into as circumstances demand.
China’s exports to EU countries continued to grow. The value of exports in June hit a three-year high of €51 billion. The value of imports from the EU also increased to €22 billion. Exports to ASEAN countries grew rapidly during the second quarter of the year. China Customs reported the value of exports to ASEAN countries was about €55 billion in March, and almost €69 billion in June. The value of exports to the United States rebounded to €38 billion in June (€26 billion in March).