BOFIT Weekly Review 16/2021
China’s first quarter economic figures show V-shape part of recovery has passed
The figures released by the National Bureau of Statistics last week show that GDP in the first quarter of 2021 rose by over 18 %. Such high on-year growth is hardly a surprise as the reference basis was China’s weakest quarter at any time during the covid crisis.
One way to get a better overall picture of the situation is to consider GDP growth in January-March compared to the previous quarter (October-December). The NBS reports that GDP grew by 0.6 % q-o-q in the first quarter adjusted for seasonal variations including holidays (2.4 % annualized rate). Quarterly growth was clearly lower than in the second half of 2020, when it was around 3 %. Quarterly growth of less than 1 % is rare in China. Before the covid crisis, such an episode was last seen at the late 1990s.
A second way to get a better overall growth picture is to see how much GDP has grown compared to pre-covid times. If the situation is compared to the first quarter of 2019, the volume of Chinese GDP is more than 10 % higher in the first quarter of 2021. Even with the pandemic, China has managed to grow at an average rate of 5 % over the past two years. China recovered quite quickly from its January-March 2020 output collapse. GDP is now already 6 % higher than at the end of 2019.
Chinese GDP can be roughly divided into three sectors: construction & industry, services and agriculture. In recent years, slightly over half of the value-added generated in China came from the service sector, about 40 % from the construction & industry sector and about 8 % from agriculture. Construction & industry have played a significant role in China’s recovery. The sector contracted in the first quarter of 2020 slightly more than the service sector, but its recovery was faster. The value-added generated by the construction & industry sector in the first quarter of 2021 was 7 % higher than at the end of 2019. The corresponding value-added generated by the services sector was up by less than 6 %. Growth in the agriculture sector has been slower, but even there output rose 4 % from the end of 2019. Prior to the covid crisis, the service sector averaged annual growth of 8 %, well above growth in the construction & industry sector (5.5 %).
Several alternative indicators are also used to get a clearer picture of Chinese GDP trends. Our updated alternative GDP figure for China shows real growth of just over 17 % in the first quarter, which is well in line with China’s official figure. However, our alternative indicator suggests that GDP over the past two years has grown much slower than official figures suggest. According to its estimates, China’s GDP growth in 2019 was already below 4 % (6 % official figure). In covid year 2020, growth was basically zero (2.3 % official figure).
Excluding the covid collapse, China’s most recent quarterly GDP growth was weakest in over 20 years
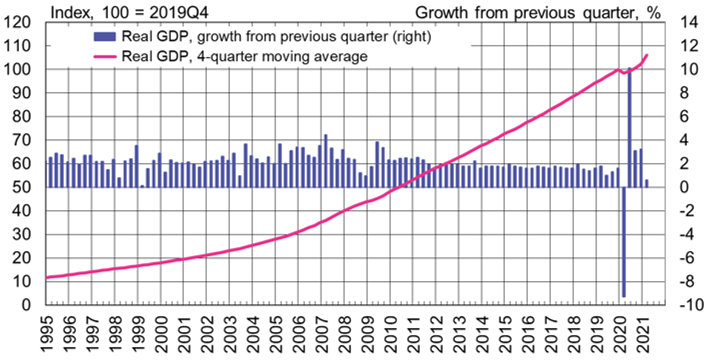
Sources: China National Bureau of Statistics, Macrobond and BOFIT.