BOFIT Weekly Review 3/2018
Growth rate in Chinese imports outstripped exports last year; trade surplus shrank
After two years of contraction, China's goods exports measured in US dollars rose last year by 8 % to roughly 2.265 trillion dollars. Driven by higher global commodity prices, the value of imports began to increase in late 2016 and continued throughout 2017. Last year's gain was 16 % to 1.84 trillion dollars. The volume of imports increased in the first eleven months of 2017 by an average of 11 %, while the volume of exports rose by 7 %. For all of 2017, the foreign trade surplus fell to 420 billion dollars, down by 90 billion dollars from 2016.
The rise in import volumes of key commodities continued. Highest growth last year was for pulp (up 13 %) and crude oil imports (10 %). Import volumes increased for coal (up 5 %) and iron ore (6 %), but with lower growth than in 2016. Copper was the exception; volumes were down by 5 % (copper prices rose nearly 30 % last year).
The EU last year increased its share of Chinese exports and imports. The value of exports to EU countries was up 13 % from 2016, and the value of imports from the EU was up by 21 %. Exports to the US, China's second-largest trading partner, were up by 12 %, while US imports rose by 5 %.
The structural evolution of the Chinese economy is well reflected in its trade figures. Over the past ten years, the ratio of foreign trade to GDP has fallen by nearly half. In 2017, exports accounted for 19 % of GDP and imports 15 %. Before the global financial crisis hit in 2008, exports were at 35 % and imports at 27 %. Structural reform is also apparent in supply chains and processing trade, which now accounts for a reduced share of total trade. E.g., imports of goods which are meant to be processed further accounted for 29 % of trade in 2017, down from nearly 50 % a decade ago.
Import volumes of key commodities to China
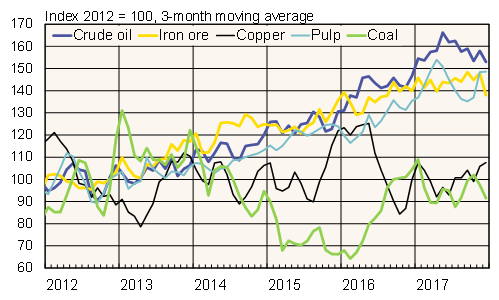
Source: Macrobond.