BOFIT Weekly Review 26/2023
China’s economic performance showed no clear signs of improvement in May; lacklustre performance reflected in financial markets
China’s National Bureau of Statistics (NBS) reports that industrial output growth slowed to 3.5 % y-o-y in May. On-year growth in retail sales declined from over 18 % in April to below 13 % in May. A factor upholding high on-year growth in retail sales has been the low basis reference numbers of 2022, when China experienced widespread covid lockdowns that limited the possibilities for consumers to spend. The value of restaurant sales, which account for over 10 % of total retail sales, was up 35 % y-o-y in May. Car sales, which account for nearly 10 % of retail sales, also saw sales growth rebound to 24 % y-o-y in May. Concurrently, the value of retail sales declined in such categories as food, household and office appliances, as well as construction and decoration materials. The NBS calculations for seasonally adjusted monthly growth show that industrial output and retail sales were up in May compared to April.
The struggles of China’s real estate sector continue. The volume of May apartment sales, measured in terms of liveable floorspace, decline by 20 % y-o-y. Sales were off by 5 % in yuan terms. The volume of housing sales in recent months has remained close to level of late 2022, so the floor for sales may have been reached. The government’s current real estate sector support measures are directed at finishing works in progress. Measured in floorspace, the volume of completed construction projects was up by 25 % y-o-y in May, while the stock of uncompleted building projects was 6 % smaller than a year ago. Nevertheless, the pullback in real estate investment and drop in new building starts continued. The volume of new building starts (floorspace) has fallen in recent months to levels less than half of the average volume of new starts in 2020 and 2021, when tighter regulation of the construction sector was introduced.
The drop in apartment sales has begun to ease this year, but the volume of new residential building starts continues to decline (series are 12 month moving sums)
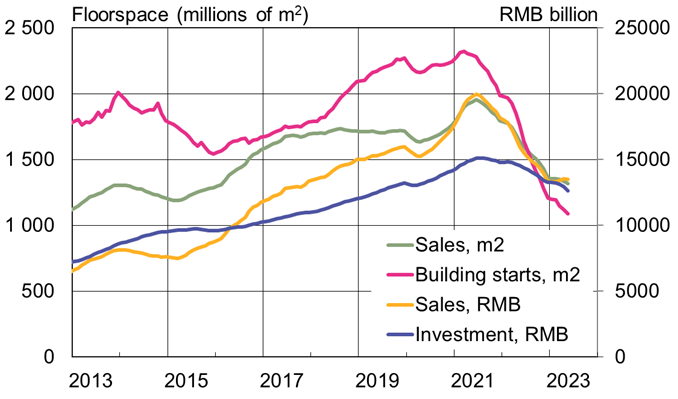
Sources: China National Bureau of Statistics, CEIC and BOFIT.
The total survey-based unemployment rate has fallen slightly from the end of last year to 5.2 % in April and May. Youth unemployment (16–24-year-olds), however, has remained stubbornly high, reaching 20.8 % in May. Officials are concerned about high youth unemployment. China’s Ministry of Human Resources and Social Security announced this month the launch of a six-month campaign to support unemployed young people.
China slightly eased its monetary stance this month (BOFIT Weekly 24/2023). In mid-June, the government revealed that it was planning an economic support package with details to be provided later. The only measure already announced is that the current tax breaks (due to expire this year) on purchases of all-electric and hybrid cars (so-called new energy vehicles) will be extended for the next four years. Market observers expect the government could use its default support measures of helping developers by easing restrictions for housing purchases and bank lending, as well as increased infrastructure investment. Both forms of support have their limits. Housing demand cannot recover without the return of investor confidence, and pushing additional funding into the real estate sector could compound current debt problems as well as fuel another real estate bubble. Additionally, the profit potential of infrastructure investments has fallen at a time when provincial finances are severely weakened. Provinces and municipalities are increasingly reluctant to take on large investment projects. Even with weaker-than-expected economic performance, China should hit its relatively modest 5 % growth target this year without major stimulus thanks to last year’s low reference basis.
China’s trade with Russia blooms as export demand in the rest of the world fades
China’s export trends generally weakened in May. The value of exports declined by 8 % y-o-y in dollar terms, and the value of imports fell by 5 %. Some of the drop in the value of foreign trade reflects lower prices and yuan depreciation. China Customs figures show more robust export volumes, and put the volume of May exports roughly on par with the May 2022 level. The volume of imports, in contrast, rose by 7 % y-o-y. While the dollar-value of exports in the first five months of this year was about the same as in the first five months of 2022, the value of exports fell in the case of the US (down by 15 % y-o-y), EU countries (down by 5 %) and Taiwan (down by 23 %). Exports to ASEAN countries were up by 7 % y-o-y. The value of imports fell by 6 % in January-May. Among China’s top trading partners, imports from South Korea were down by 27 % y-o-y, Taiwan (down by 27 %) and Japan (down by 17 %).
China-Russia trade has been going gangbusters this year. Russia now accounts for 3 % of China’s total exports and 5 % of China’s imports. The value of China’s exports to Russia in January-May was up by 75 % from the same period last year, while the value of China’s imports from Russia was up by 24 %. The value of imports to Russia and exports from Russia this year has more than doubled from January-May 2019 (i.e. before the covid pandemic and Russia’s invasion of Ukraine). Vehicle exports, which now account for about a fifth of China’s exports to Russia, have nearly tripled from the same period in 2022. The value of imported oil and petroleum products (nearly 80 % of imports) was up by 22 % y-o-y in January-May. In terms of volume, China imported 24 % more crude oil than it did a year earlier. Russia also surpassed Saudi Arabia as China’s largest oil provider, and currently accounts for about 18 % of China’s total oil imports. According to figures from China Customs, China last month paid an average of 528 dollars per metric ton of Russian crude oil, compared to 633 dollars for a ton of Saudi Arabian crude. China’s average price paid for imported crude in May was 589 dollars a ton.
Flat first-half performance for Chinese stocks
Mainland China stock exchanges were up at the end of last year and January this year on the reopening of the Chinese economy after the lifting of covid restrictions. The price gains have since largely evaporated. In end-June the main indices of the Shanghai and Shenzhen exchanges were up by just 3 % from the end of last year. The average share price on the Hong Kong Stock Exchange (Hang Seng index) was down by 5 % from the start of this year, while shares of companies listed on the Shenzhen bourse’s high-growth ChiNext index were down by 7 %. In the same period, the average price of shares listed on US exchanges (S&P 500) were up by 15 %, while share globally (FTSE All World) rose by 12 %.
Slower-than-expected economic growth and monetary policies running counter to the rest of the world have driven foreign investors to reduce their mainland China exposure. During the second quarter of this year, the value of shares sold by foreign investors via the Stock Connect programme with the Hong Kong Stock Exchange was 6 billion yuan greater than the value of shares purchased by foreign investors via Stock Connect. The value of shares purchased under an exchange link programme that gives Chinese investors access to the Hong Kong Stock Exchange saw Chinese investors purchasing 47 billion yuan more in shares than they sold.
Driven by the above-mentioned factors, the yuan’s external value continues to slide. The yuan-dollar exchange rate is 8 % weaker than its January peak. As of end-June, one dollar bought 7.26 yuan. It seems currently the People’s Bank of China has not tried meaningfully restrain the yuan’s fall with its daily mid-point reference rate-setting to the dollar or intervention in forex markets. The value of China’s foreign currency reserves has remained fairly stable since the start of the year, standing at 3.177 trillion dollars at end-May.
Chinese share prices were at roughly the same level at the end of June as they were at the start of this year
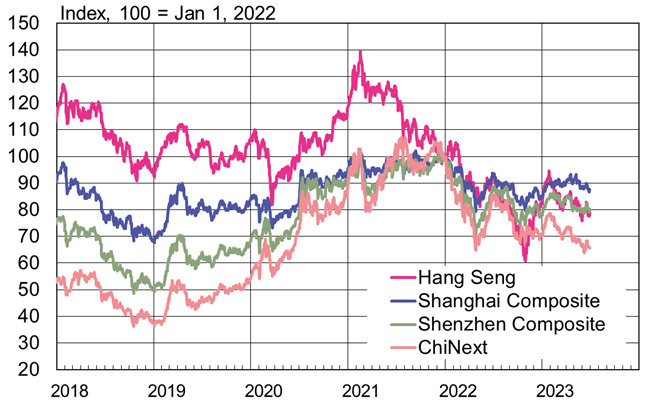
Sources: Macrobond and BOFIT.
Real 12-month change in key indicators and consumer prices, %

Sources: China National Bureau of Statistics, China Customs, WTO, CEIC and BOFIT.