BOFIT Weekly Review 33/2023
Ruble plummets as Russia’s current account surplus evaporates
The ruble’s exchange rate in August reached its lowest reading against the US dollar since spring 2022. The official ruble-dollar exchange rate this week crept above 100, making the ruble worth less than one US cent. The ruble has lost about 40 % of its value since last August.
To quell inflationary pressures caused by the ruble’s dramatic slide and constraints on domestic demand, the Central Bank of Russia raised its key rate by 350 basis points at an unscheduled meeting on August 15. The key rate currently stands at 12 %. Media reports claim that reinstatement of various currency controls in Russia is under discussion.
The ruble’s vanishing value mainly signals the end to an episode of exceptionally high current account surpluses. The preliminary CBR estimate is that the current account surplus for January-July this year was just 25 billion dollars, or 85 % less than in the same seven-month period last year. A BOFIT blog post (in Finnish) this week deals specifically with the implications of Russia’s growing imbalances.
The ruble has lost considerable value against the US dollar this year
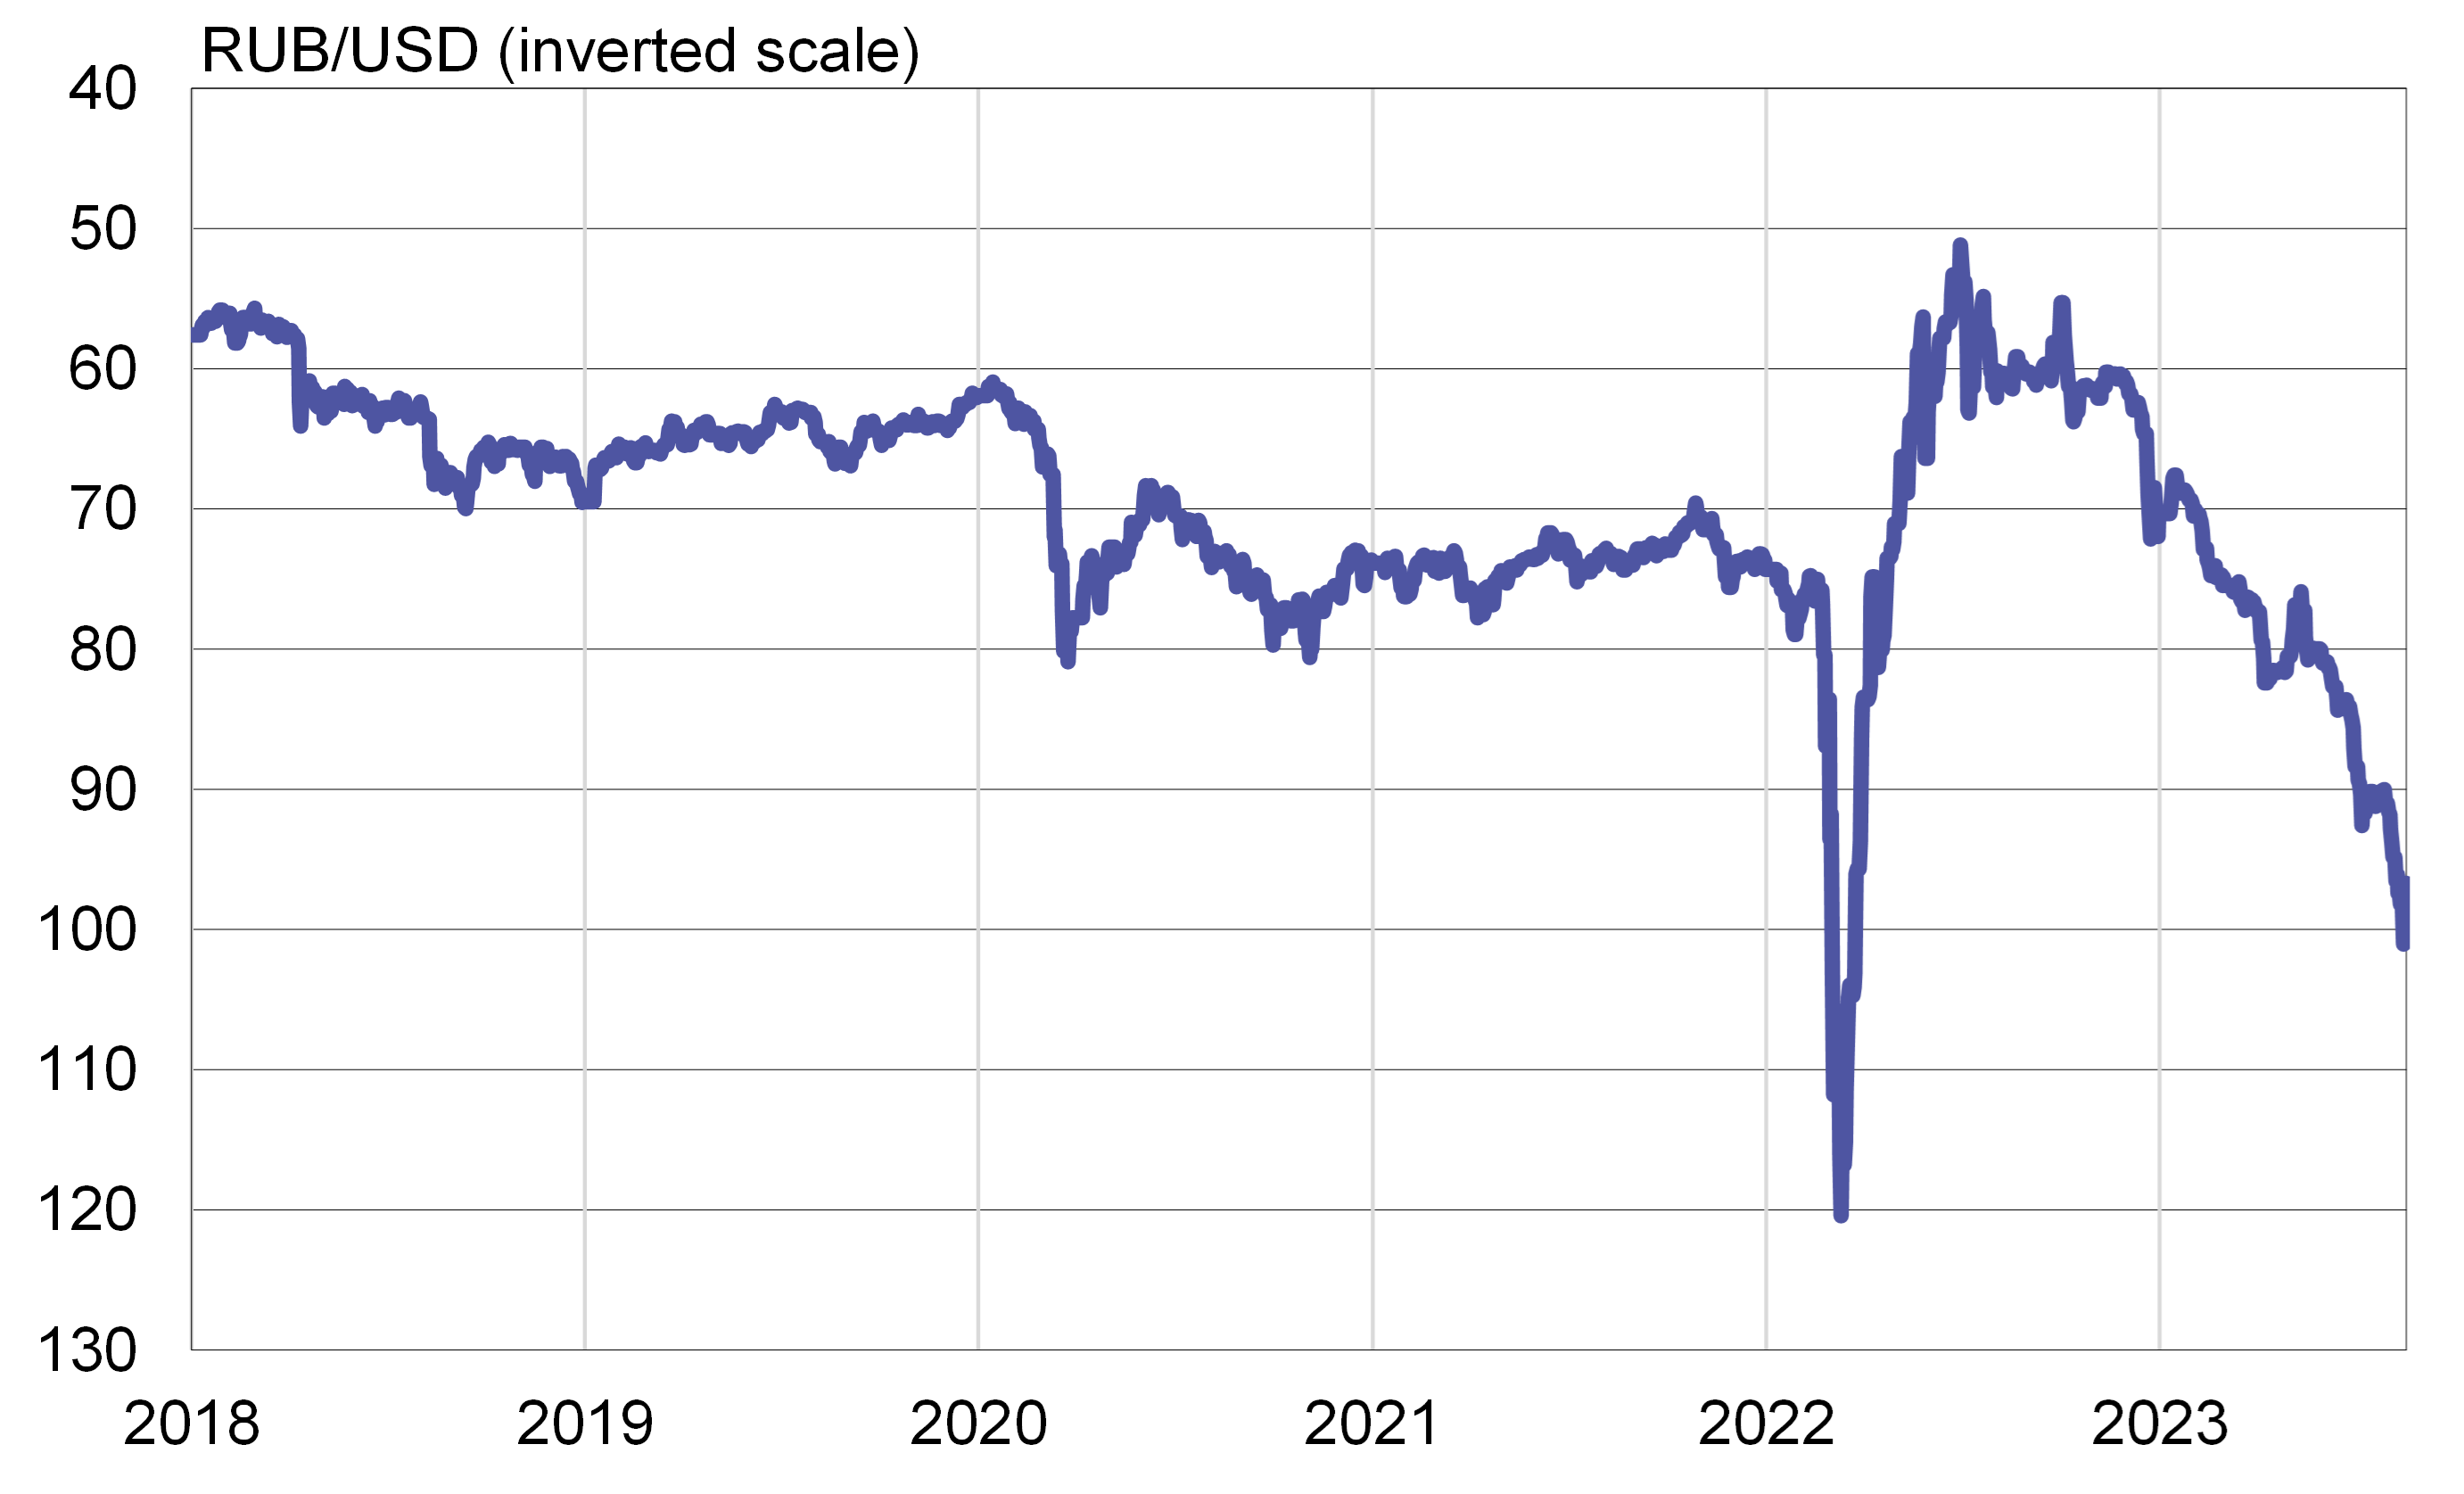
Sources: Macrobond and BOFIT.
Russian export earnings down, but nowhere near historical lows
Russia’s export earnings in the first half shrank considerably from last year’s record highs. According to preliminary CBR figures, the value of goods exports in January-June was a third less than a year earlier. Export revenues were hurt most by lower prices due to global market developments and sanctions on Russian exports. The volume of Russian natural gas exports has also contracted sharply with Russia’s decision to cease supplying pipeline natural gas to many EU countries. The value of goods exports is nowhere near the historical lows of the past decade, but hovering around the same level as in the first half of 2019.
The International Energy Agency (IEA) estimates that the average price of Urals blend crude oil was 48 dollars a barrel in January-June, or about 40 % less than a year earlier. The volume of Russian crude oil exports in the first half shrank by about 4 % y-o-y. The combined volume of exports of crude oil and petroleum products in 1H23 remained at the same level as a year earlier. Nearly 60 % of Russia’s total oil exports (crude oil and refined petroleum products) now go to China and India.
The volume of Russian oil exports has been declining in recent months and has been accompanied by a rise in the export price of Urals crude. The IEA estimates that in July Russia produced slightly less oil than was allowed under its OPEC+ agreement quota. Russia has also said it will reduce oil exports during August and September. The IEA estimates that the average price of Urals crude rose above the 60-dollar mark in July and exceeded 70 dollars a barrel in the first days of August. Prices of all oil grades have risen in recent weeks. The price difference between Urals and other oil grades has also narrowed.
Under the price ceiling mechanism imposed on Russian oil by G7 countries and the EU, corporations headquartered in these countries are not allowed to provide services like shipping or insurance related to sea cargoes of Russian oil if the contracted price of the oil exceeds 60 dollars a barrel. According to the IEA, in recent months about 70 % of Russian crude oil shipments have involved transport or insurance provided by companies based in G7 countries.
The value of Russian goods exports has contracted due to lower oil prices, but is still above historical lows
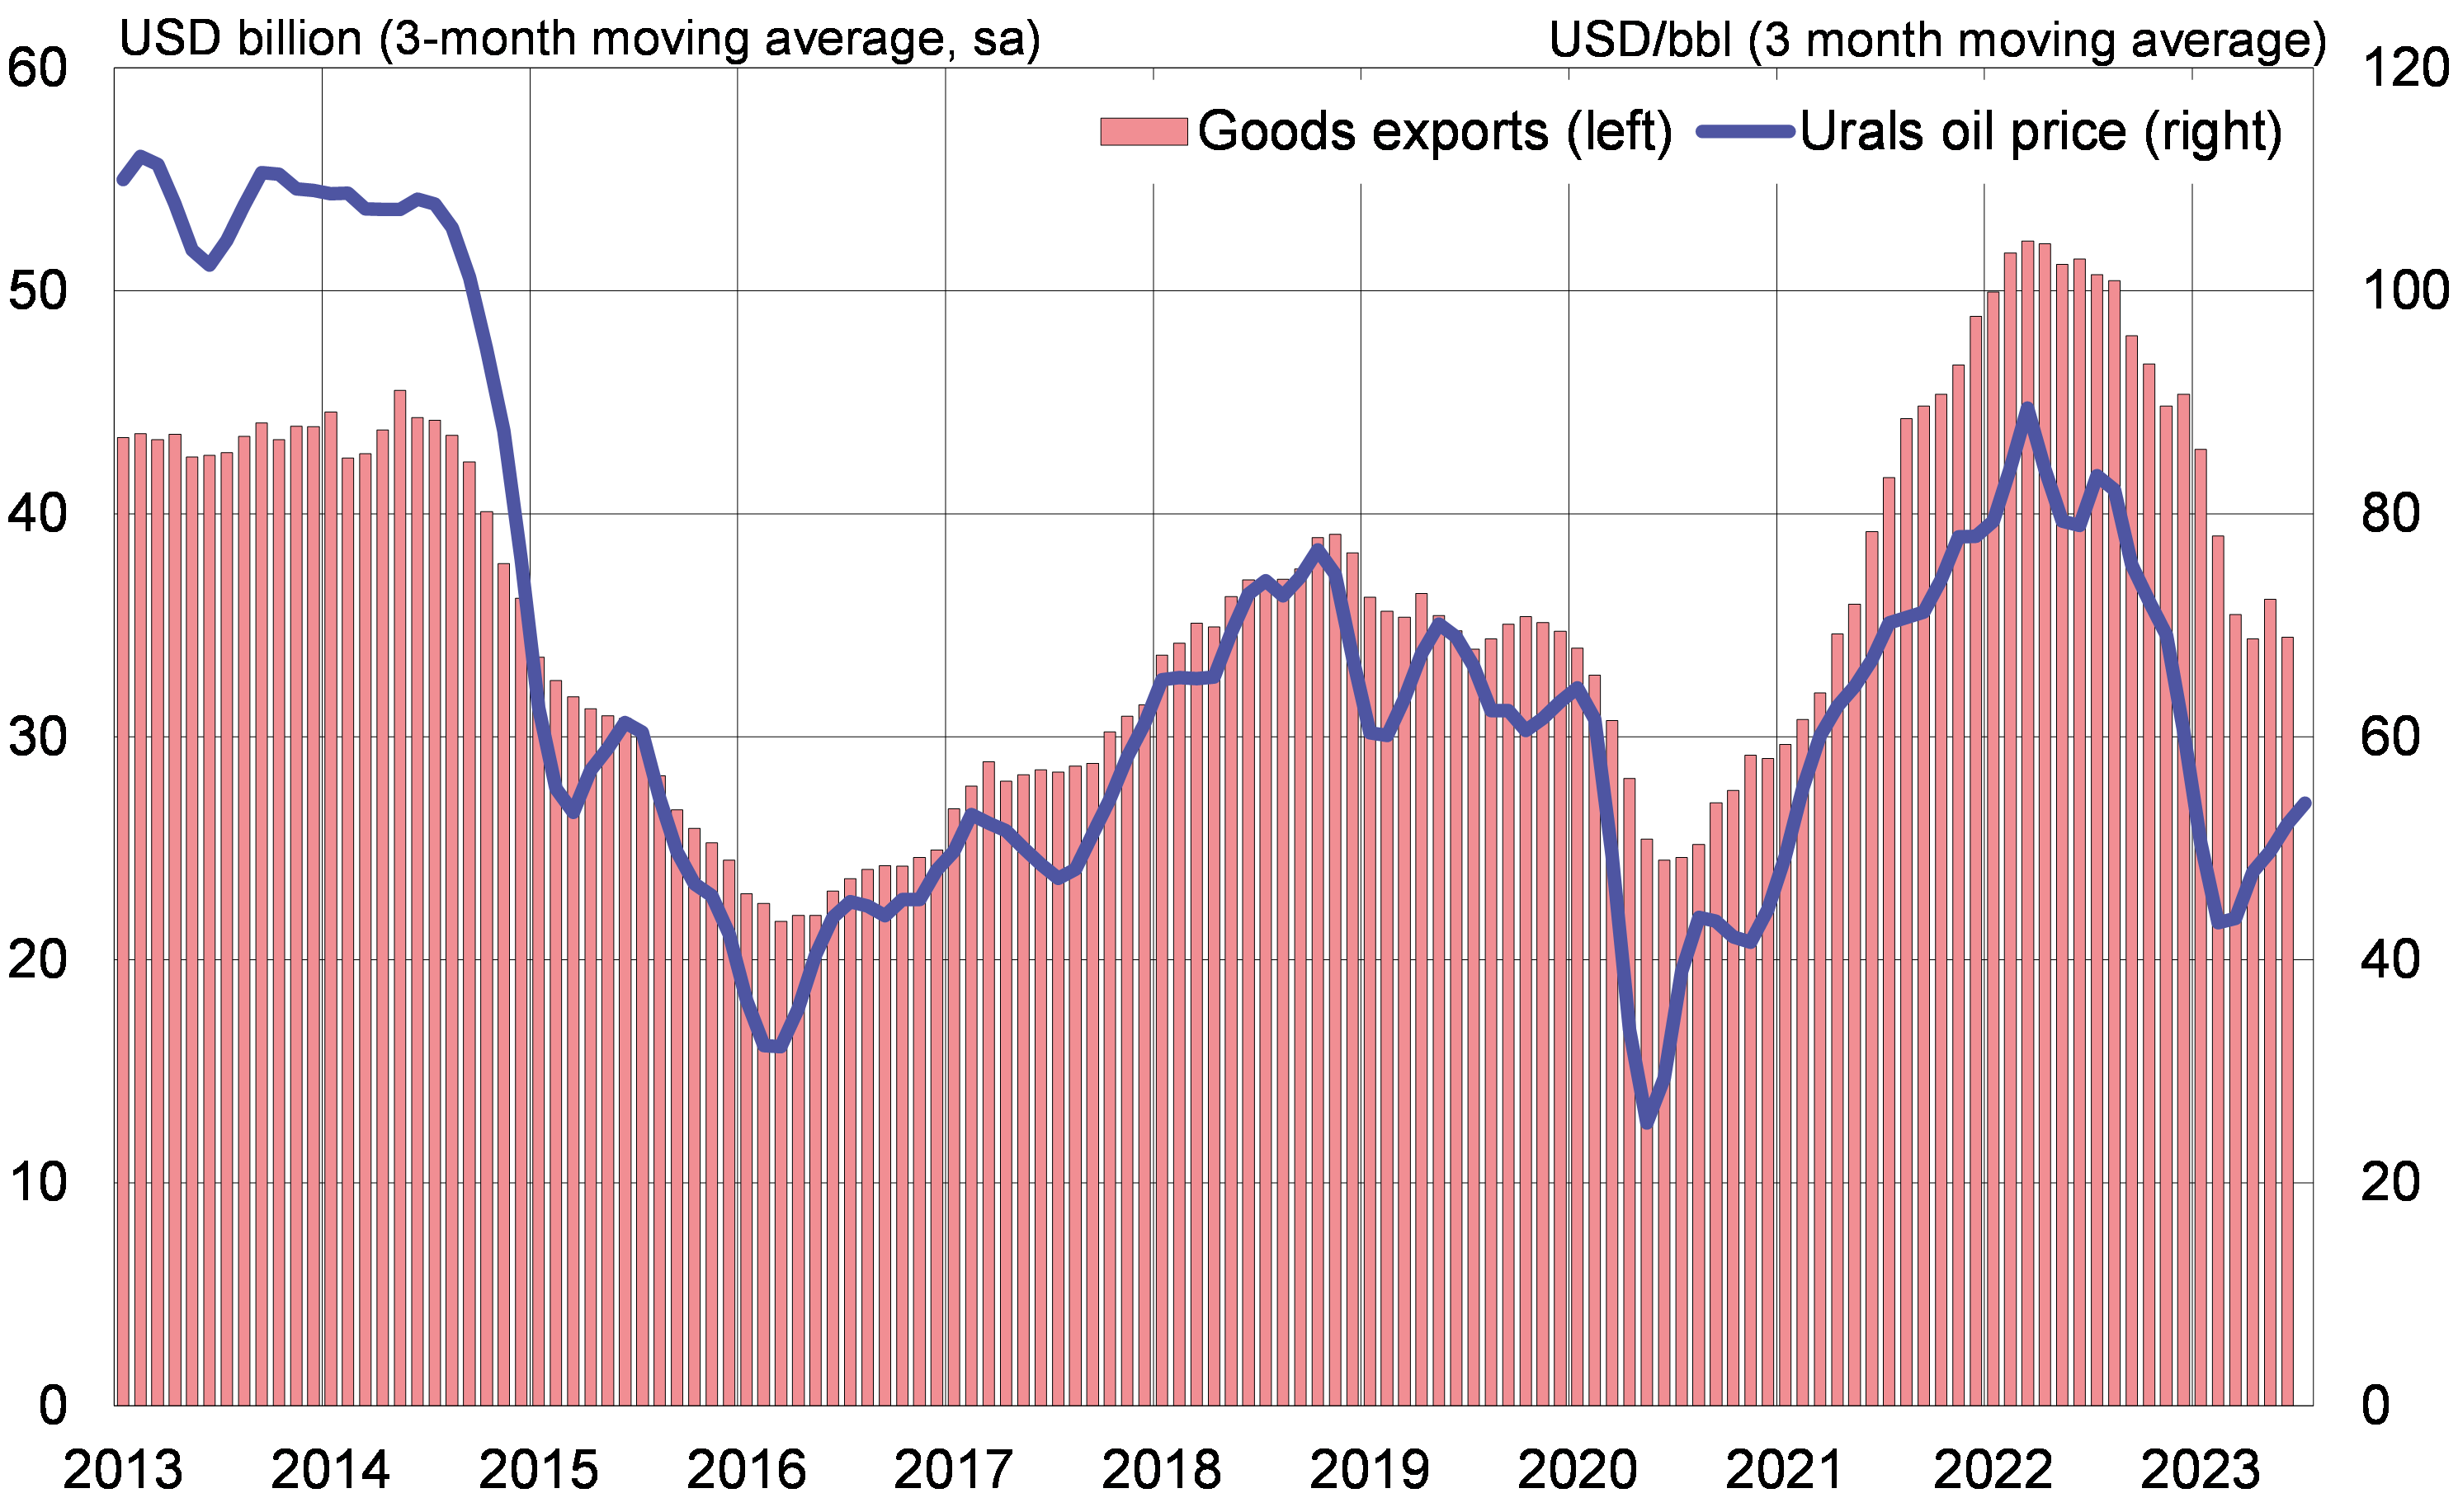
Sources: Central Bank of Russia, Macrobond, IEA and BOFIT.
Slower recovery for Russia’s technology imports than for other imports
Russian imports have recovered gradually since the sharp decline of spring 2022. Preliminary CBR figures show that in recent months the value of goods imports (seasonally adjusted) has stabilised at roughly the same level as the 2021 average, but was still slightly lower than in the months leading up to the February 2022 invasion of Ukraine. The IMF’s export figures, which cover nearly all countries, allow for mirror calculation of Russian imports. While the numbers of countries exporting to Russia generally show the same trends as noted by the CBR import figures, the mirror export figures suggest a slightly slower recovery in Russian imports.
Russian goods imports have recovered to near pre-invasion levels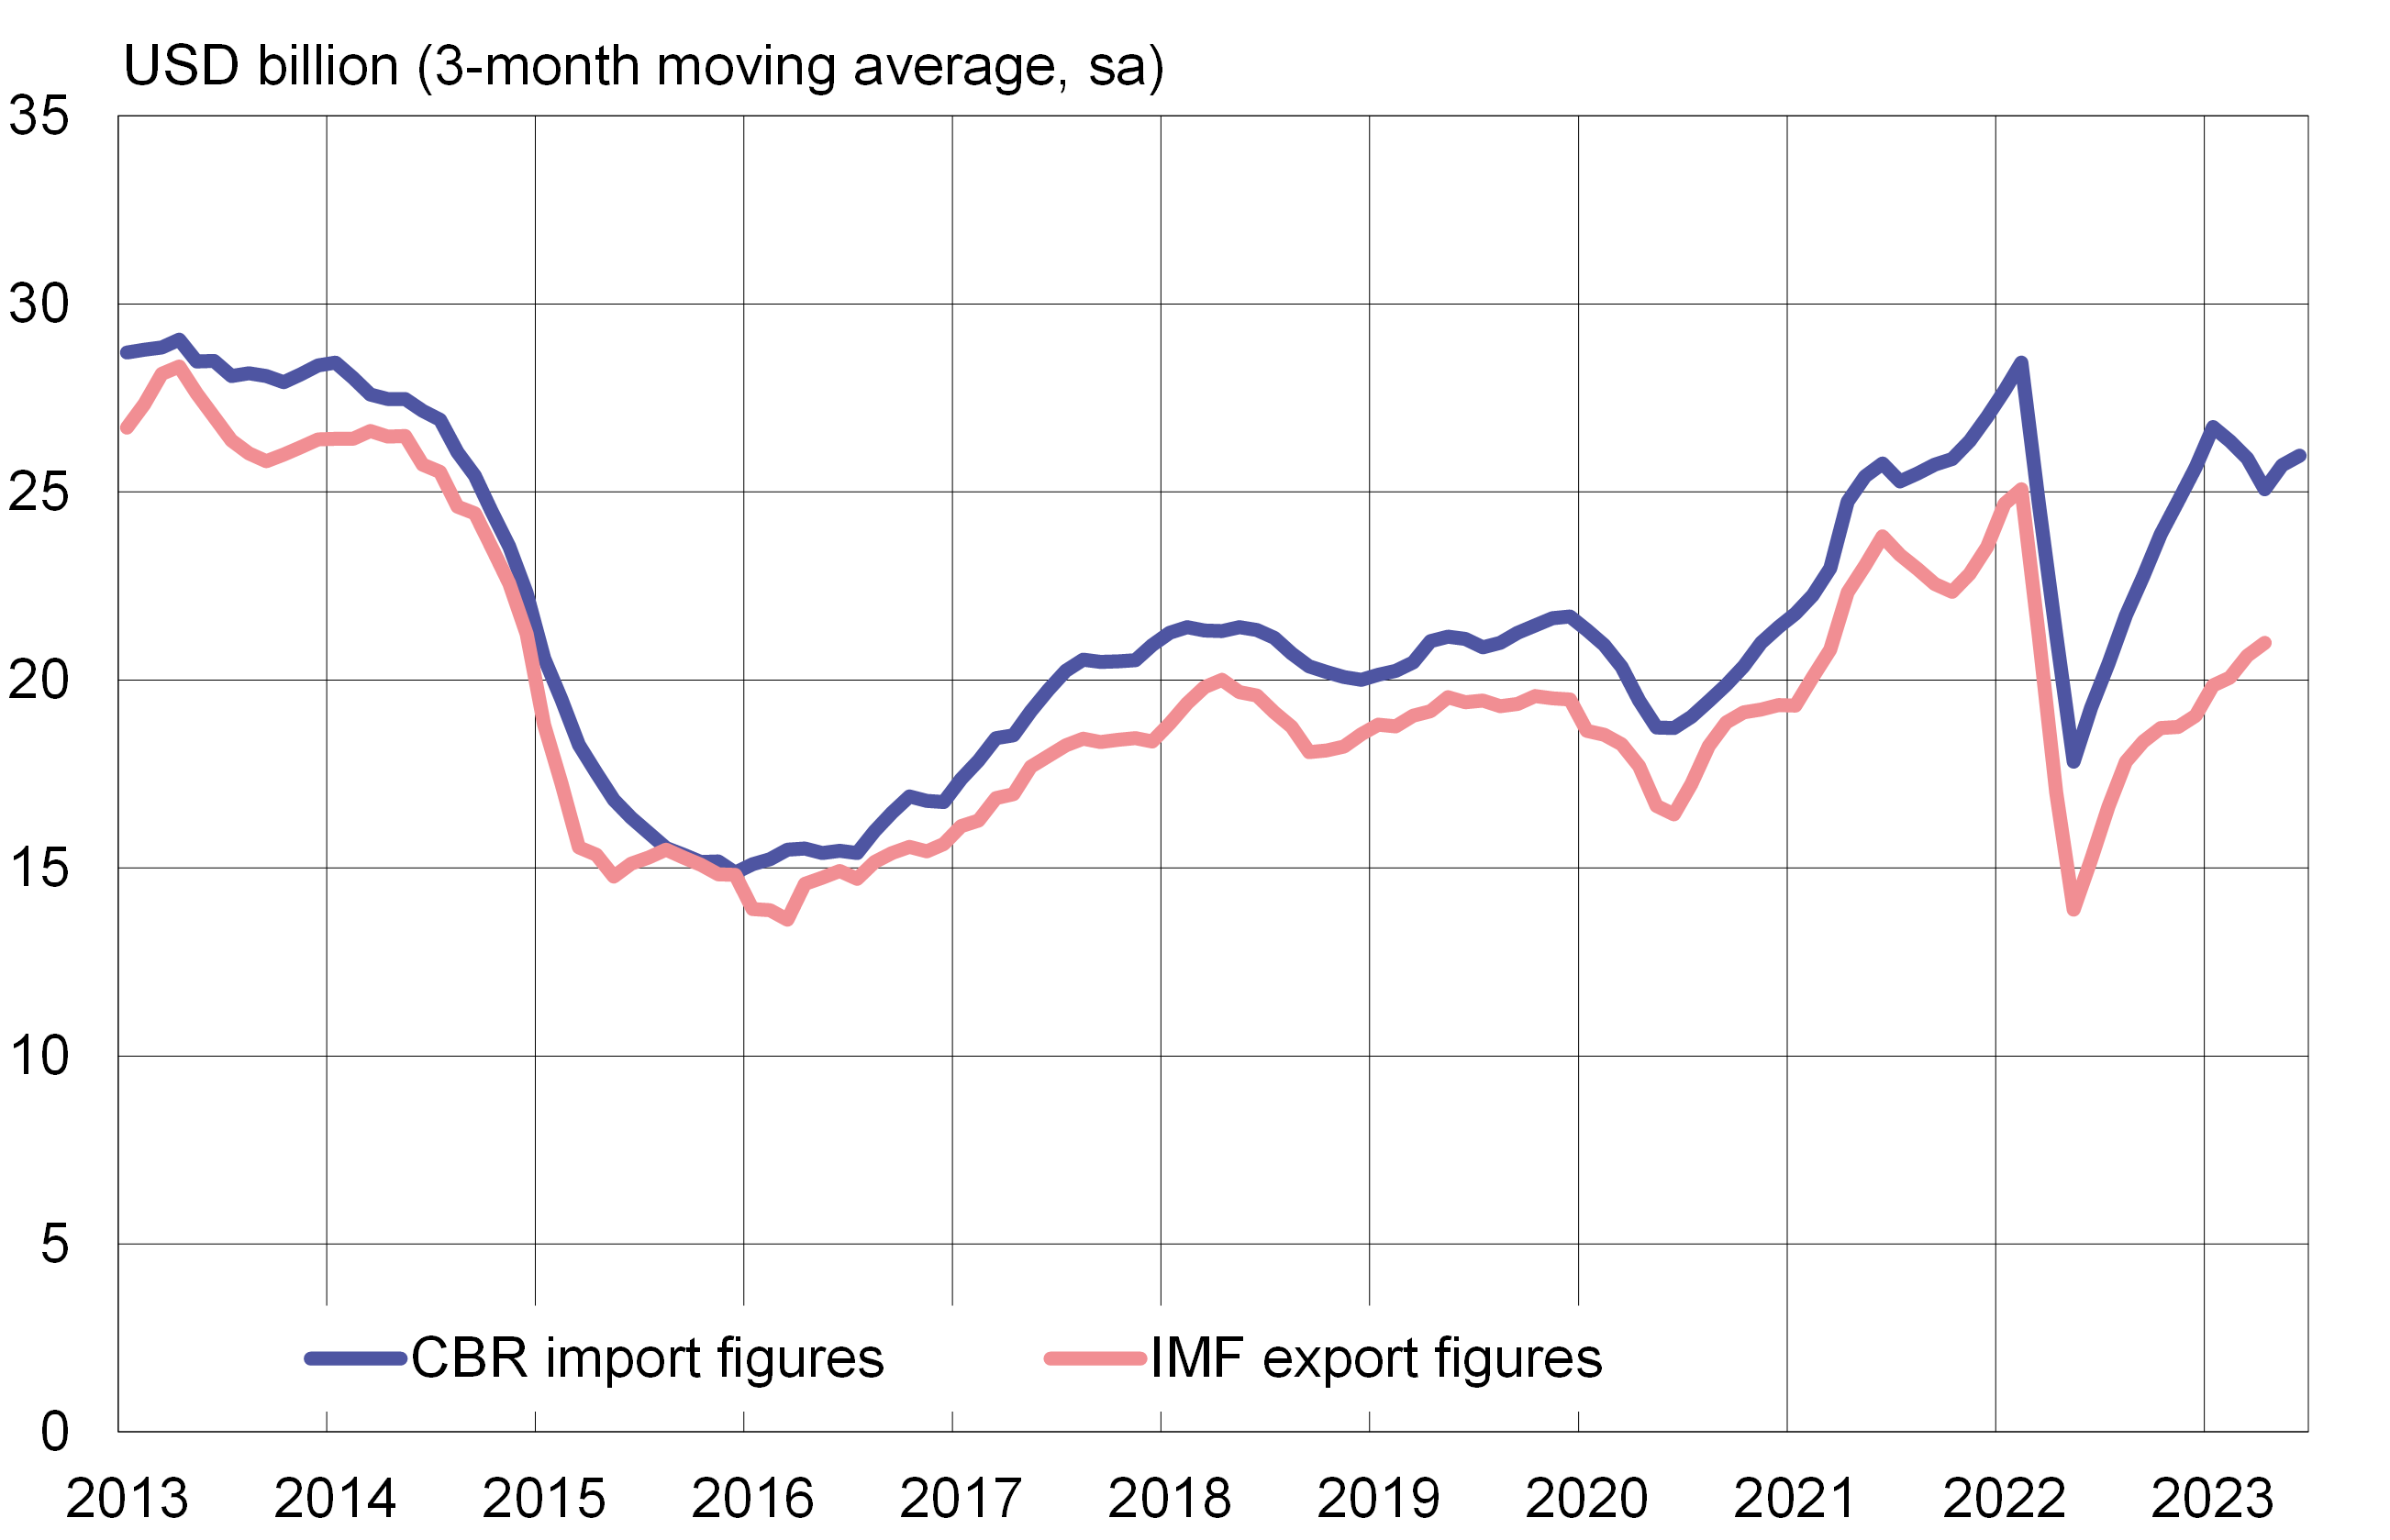
Sources: CBR, IMF DOTS and BOFIT.
Russian Customs has ceased to regularly publish foreign trade figures, so up-to-date official statistical breakdowns of Russian imports by country of origin and product category are unavailable. Mirror statistics of Russia’s trading partners can also be used to evaluate shifts in Russia’s trade structure.
Based on the estimates of about 80 countries’ goods exports to Russia, the value of exports was down in January-April by about 6 % from the corresponding time period in 2021. Imports of technology products have recovered more slowly than imports generally. Imports of electrical, optical and similar equipment were still down by about 15 % in January-April from the same period in 2021. The value of machinery imports was also down by nearly 10 %. In contrast, car imports were only down by 3 % and imports of other goods were at about at the same level as in January-April 2021. The trend in the volume of imports is likely weaker than the import value trend as prices of many imported goods and shipping costs have risen.
Imports of technology products have recovered more slowly due mainly to Western sanctions. While export restrictions focus on technology products, tech exports to Russia are generally not banned. Moreover, sanctions on exports of passenger cars typically only apply to high-end models.
Based on IMF export figures, the EU accounted for about 20 % of Russian goods imports, while China and Hong Kong provided about 40 % of imports, followed by the countries of the Eurasian Economic Union with about 15 % and Turkey with 5 %.
Russia’s imports of technology products have yet to recover to 2021 levels according to mirror statistics
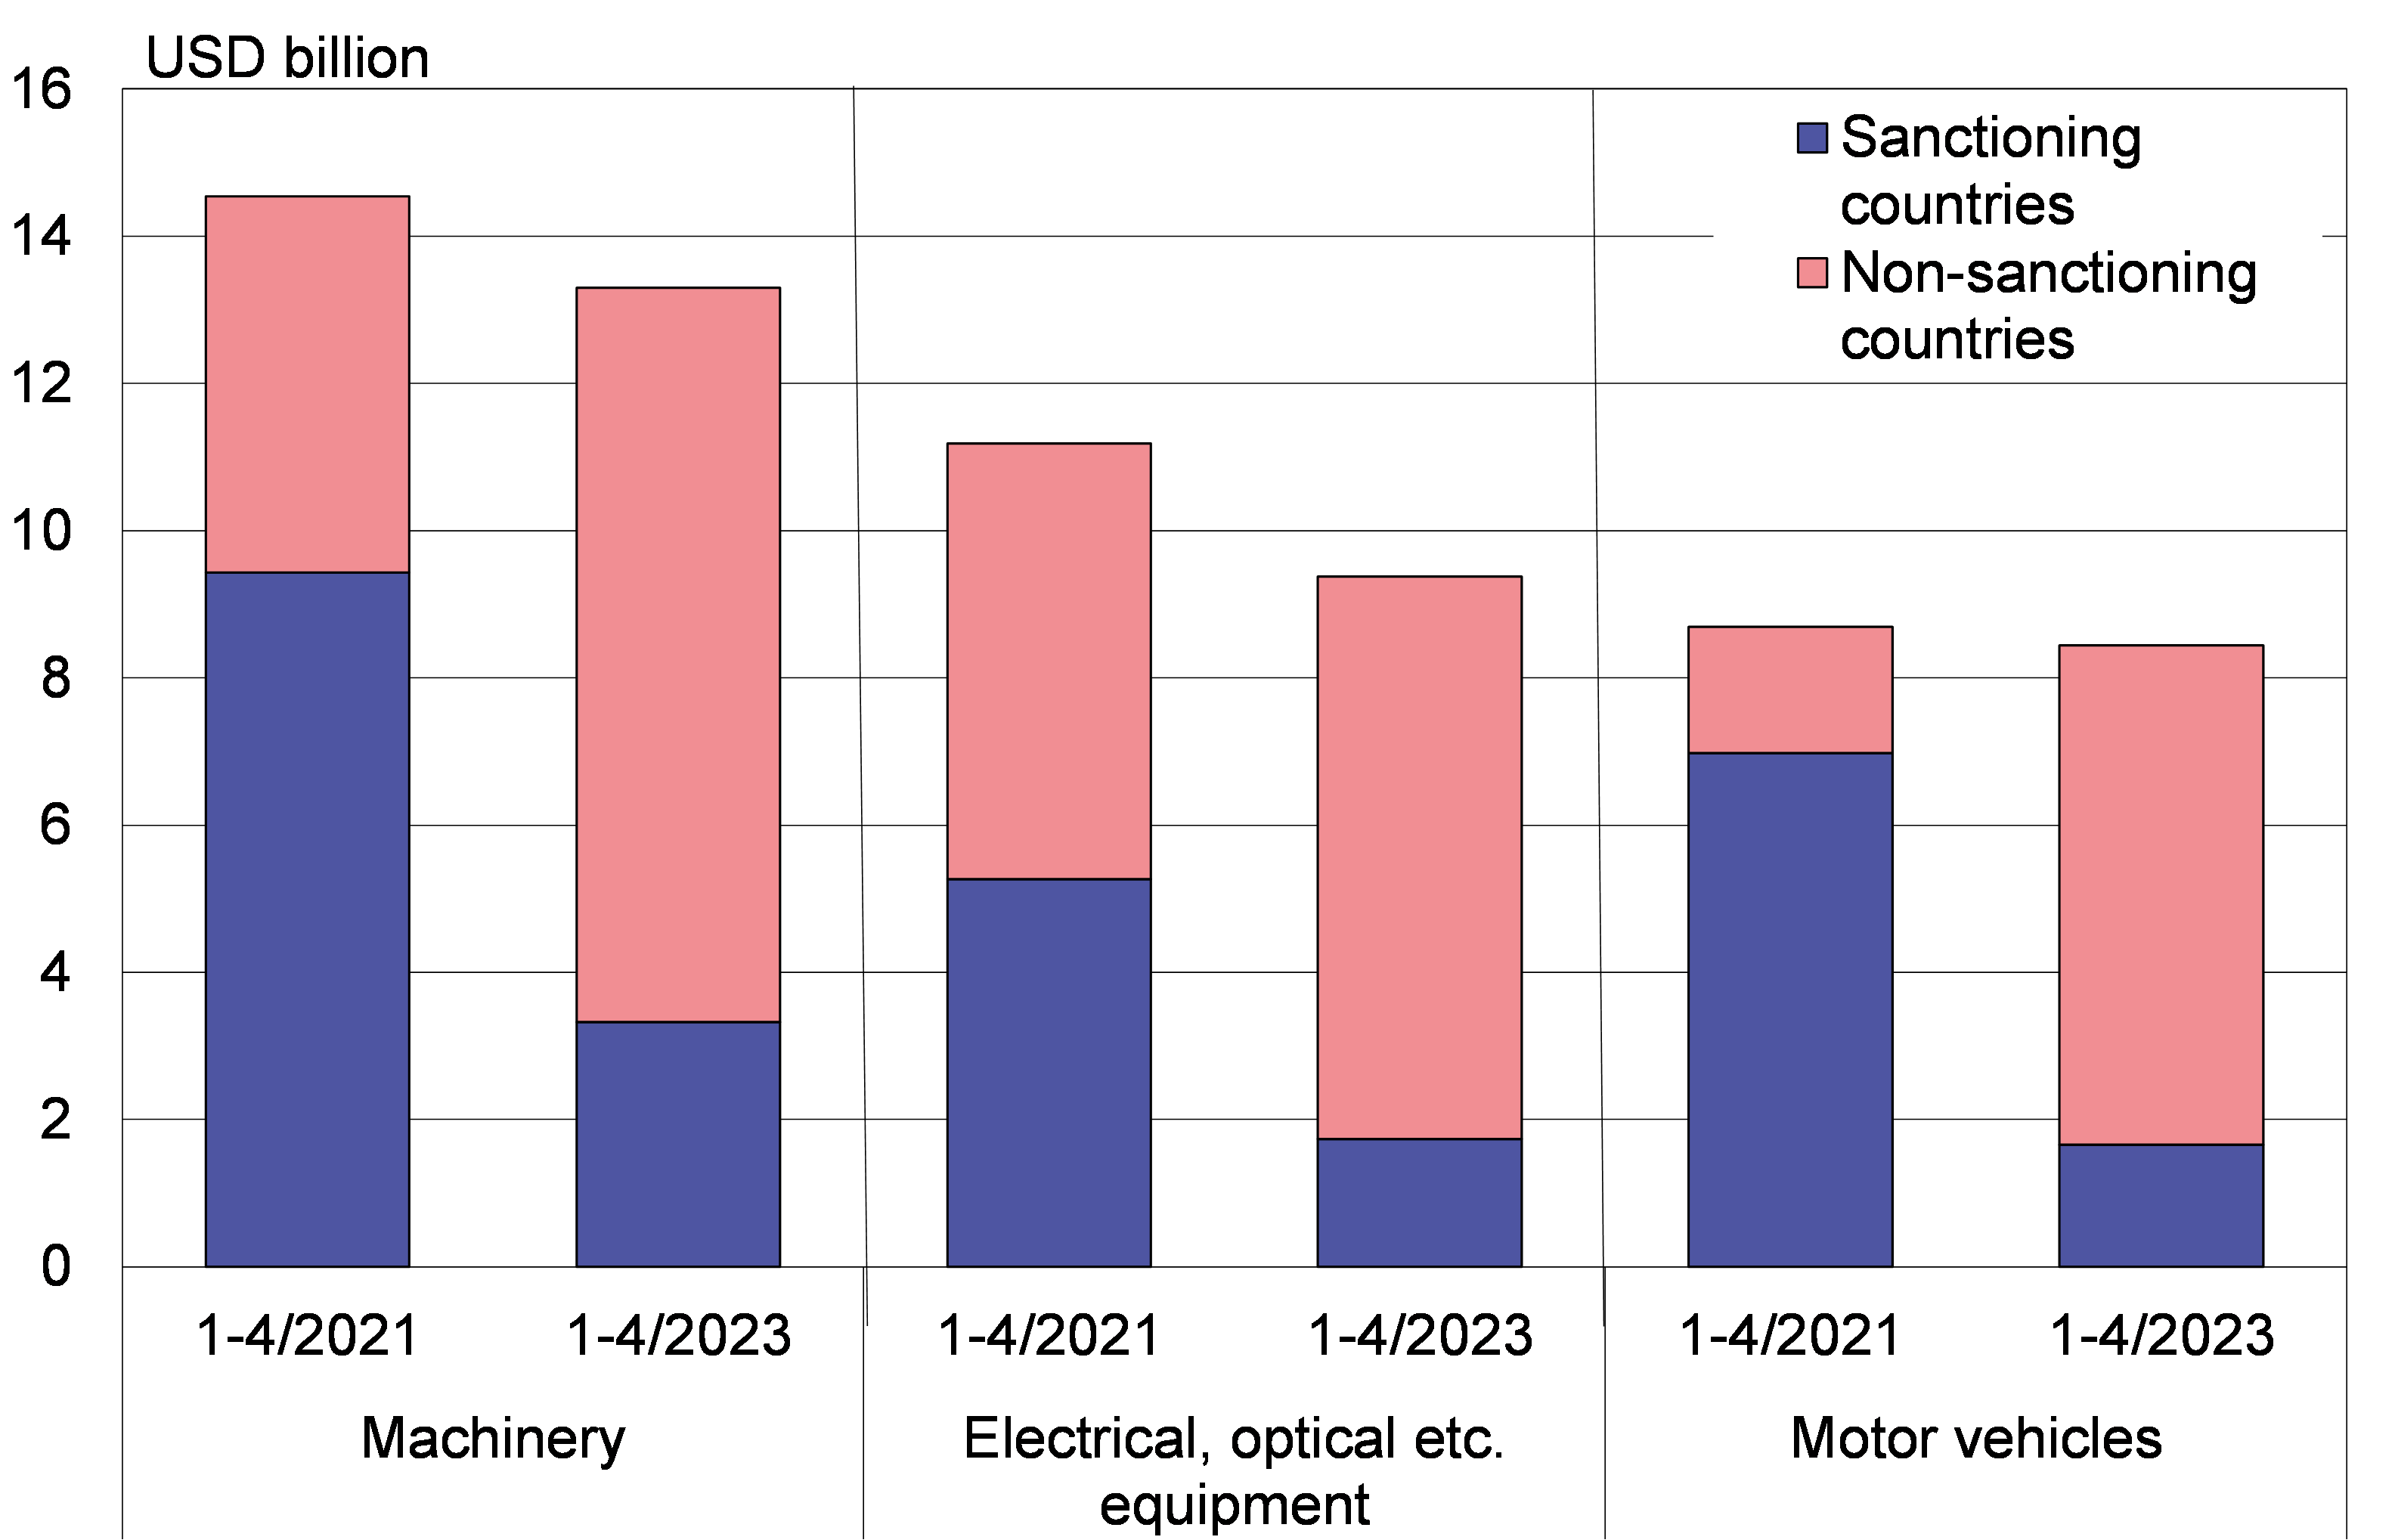
Sources: Global Trade Tracker, Kazakhstan Bureau of National Statistics and BOFIT.