BOFIT Weekly Review 20/2016
Fall in Russian imports begins to moderate
The value of goods imports in January-March contracted 15 % y-o-y to just under $40 billion. The contraction in imports slowed considerably in all main product categories, and Russia’s Federal Customs Service noted that import volumes of certain products even recorded growth. The EU’s share of Russian imports rose slightly to nearly 40 %. Russian imports from e.g. France and Estonia were up nearly 20 %. Russian imports from China contracted 12 % y-o-y, but China, which accounted for over 20 % of Russia’s imports, was still the single most important import provider by far. Imports from Turkey were down 60 % y-o-y, partly due to Russia’s decision at the end of last year to ban imports of many Turkish food products.
The value of Russian goods exports contracted in January-March by about a third to $60 billion due largely to lower export prices. The average price of Urals-grade crude oil was $32 a barrel for the period, down from $53 a barrel a year earlier. In addition, the growth in export volumes of major commodities slowed or went into decline. Growth in crude oil exports slowed to 4 % y-o-y and the export volumes of oil products shrank by 16 %.
Among key metal products, export volumes of ferrous metals and aluminium went into slight decline, whereas in exports of copper and nickel growth slowed visibly. The ruble’s real effective (trade-weighted) exchange rate in 1Q16 was still 5 % lower than a year earlier.
Export volume trends of select Russian export commodities
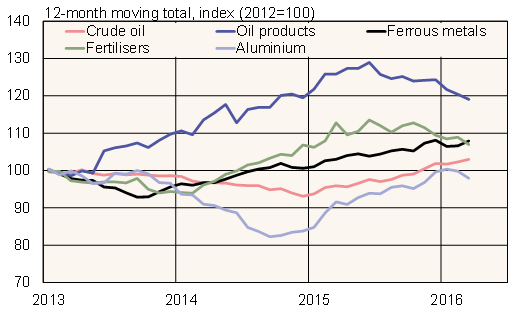
Sources: Macrobond / Federal Customs Service of Russia.