BOFIT Weekly Review 40/2025
The United States remains China’s top final export destination
At the beginning of September, the Organisation for Economic Cooperation and Development (OECD) updated its Trade in Value Added (TiVA) database to include data until 2022. The value-added statistics, which are based on input-output data, have a long lag as they rely on the statistical authorities of 76 countries. Value-added statistics help round out the picture obtained from other international trade indicators, as they break down the value added of services and goods produced and consumed by each reporting country and economic sector, which allows for better examination of trade relations between countries. In China’s case, this is especially important today as it produces considerable amounts of goods that are exported to third countries in e.g. Southeast Asia, even though the ultimate destination of the goods is a Western country.
The OECD reports that almost 15 % of the value added produced in China in 2022 was exported (final consumption abroad). After falling from above 20 % in 2006–2008 to 13 % in 2019, that share began to rise during the pandemic years. The most important markets for Chinese value added can still be found in Western countries. In 2022, 19 % of the added value exported abroad was ultimately consumed in the US and 18 % in the EU. If Japan, the UK, Australia and Canada are included, over half (52 %) of the Chinese value added exported abroad is consumed in the “West.” The share of the “West” in has remained roughly the same for the past ten years. There are some variations, however, among Western countries. The US share as a consumer of Chinese value added has diminished a bit in recent years, while the EU’s share has increased. Although the US share in final consumption of Chinese value added has decreased slightly, it should be noted that in dollar terms the Chinese value added consumed by the US has continued to rise. With respect to the EU, it is notable that in 2021 and 2022 more Chinese value added was consumed in the EU than American value added for the first time. Also Finland is consuming more Chinese value added than American.
In 2022, China’s domestic economy accounted for 88 % of the value added consumed, a level at which it had stabilised since 2015. The share seems to be rather typical for a large economy as the share of domestic value added in final consumption has been the same for the US for a long time (88 %). Of the foreign value added consumed by China in 2022, 15 % came from the EU and 11 % from the US. When the “West” is construed to include Japan, Australia, the UK and Canada, the share of foreign value added imported by the “West” was 41 %. The share of the “West” in China’s consumption has been falling in recent years, down from 49 % in 2016. While the US share has shrunk most US (down by 3 percentage points), the shares of the EU and Japan have also diminished (both down by 2 percentage points). The trend probably reflects the development of China’s domestic production. The need to acquire Western value added has decreased as the level of domestic production and services has improved. At the same time, China increasingly consumes value added produced in ASEAN countries (11 % share in 2022) and has increased value added consumption rapidly from countries that produce raw material inputs such as Russia (4 % share of China’s consumed value added in 2022), Brazil (4 % share), Indonesia (3 %), Saudi Arabia (3 %), as well as Norway (near 2 %). Finland accounted for 0.3 % of China’s value added consumption, a share that has remained quite stable over the past ten years according to the new data.
The OECD’s most recent value-added figures do not indicate a significant decoupling of the US and Chinese economies. In terms of value, the US consumes more Chinese value added and China more US value added. The respective shares have dropped because the value added consumption of other countries has increased more rapidly.
Final consumption of Chinese value added abroad (“exports”, left) and foreign value added consumed in China (“imports”, right)
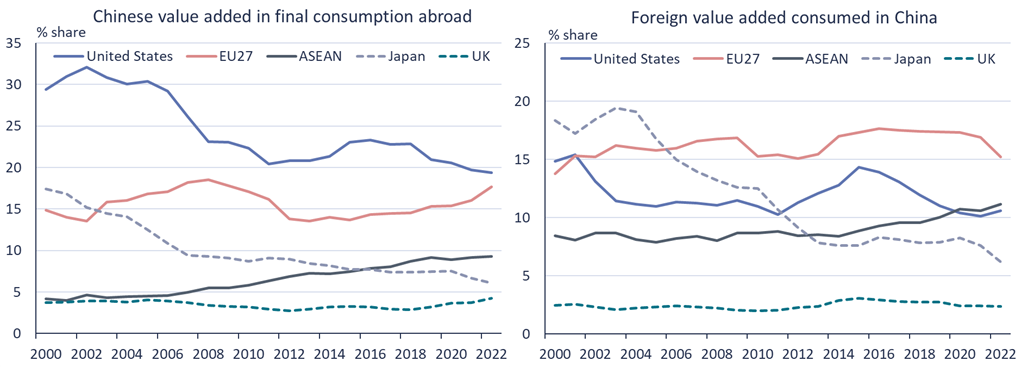
Sources: OECD TiVA 2025 and BOFIT.