BOFIT Weekly Review 13/2023
No signs of improvement for the Russian economy
Rosstat reports that industrial output contracted by 2 % y-o-y in January-February. Mining & quarrying production fell by 3.1 %, with the most notable drops in output of coal (down by 2.3 %) and natural gas (-13.5 %). Oil production fell only slightly (-0.6 %). The decline in manufacturing output continued with the volume of production in January-February down by 1.7 % y-o-y. Industry showed strong divergent trends. Production in branches dependent on foreign trade continued to shrink, while branches geared to serving the emerging wartime economy experienced strong growth.
The volume of retail sales shrank by 7.2 % y-o-y in the January-February period. Food sales were down slightly, but sales of non-food items were off by 11.4 % y-o-y. The drop in retail sales largely reflected the decline in sales of durable goods. Some of this decline reflects lack of supply as sanctions and logistical challenges limit imports of e.g. household appliances.
The February 2022 invasion sparked fears of higher prices, forced households to accelerate their spending plans and caused consumer spending to spike in March 2022. Although retail sales suffered an approximately 10 % drop in April last year, the situation stabilised thereafter. While the 12-month change in March retail sales this year is likely to be similar to the previous two months, the 12-month change is expected be diminish in the months ahead.
The economy continues to be supported by growth in the agricultural and construction sectors. Construction activity increased by 11 % y-o-y in the first two months of this year, although housing construction experienced no growth whatsoever. Most of the growth in construction likely came from the stepped-up pace of public infrastructure projects.
In January-February, nominal federal budget revenues plunged by nearly 30 % y-o-y, while expenditures increased by about 50 %. The spending burst is due in part to changes in public procurement policies. As much as 90 % of the value of projects this year will be paid up front in an effort to stimulate industrial output, particularly the military-industrial complex. Nominal spending on government procurements in January-February 2023 was up by about 350% from a year earlier. The federal budget deficit has skyrocketed, reaching nearly 4 % of GDP for the 12-month period ending in February. Spending growth in the consolidated budget (federal, regional and municipal budgets plus state social funds) remained rapid last year, with spending in the fourth quarter up by nearly 20 % y-o-y. The consolidated budget deficit in 2022 was 1.4 % of GDP. The federal budget deficit was 2.3 % of GDP.
Exceptionally low unemployment rate
As a consequence of war and mobilisation, Russia faces a labour shortage that can already be seen in wage growth. The national unemployment rate fell to just 3.5 % in February, its lowest level of the post-Soviet era. In the most industrialised regions in the Central Federal District of Russia, as well as Moscow and St. Petersburg, the unemployment rate is currently below 3 %. While there are still large fluctuations across regions, the sole regional unemployment rate in excess of 10 % was found in regions in the North Caucasus. Despite recession, growth in nominal wages has remained brisk. Moreover, real wages should start rising this year as inflation ebbs. In January, nominal wages were up by 12.4 % y-o-y, and the average real wage up by 0.6 %. The rise in the average wage was most pronounced in government administration and the currently thriving branches of industry such as metal refining and machine-building.
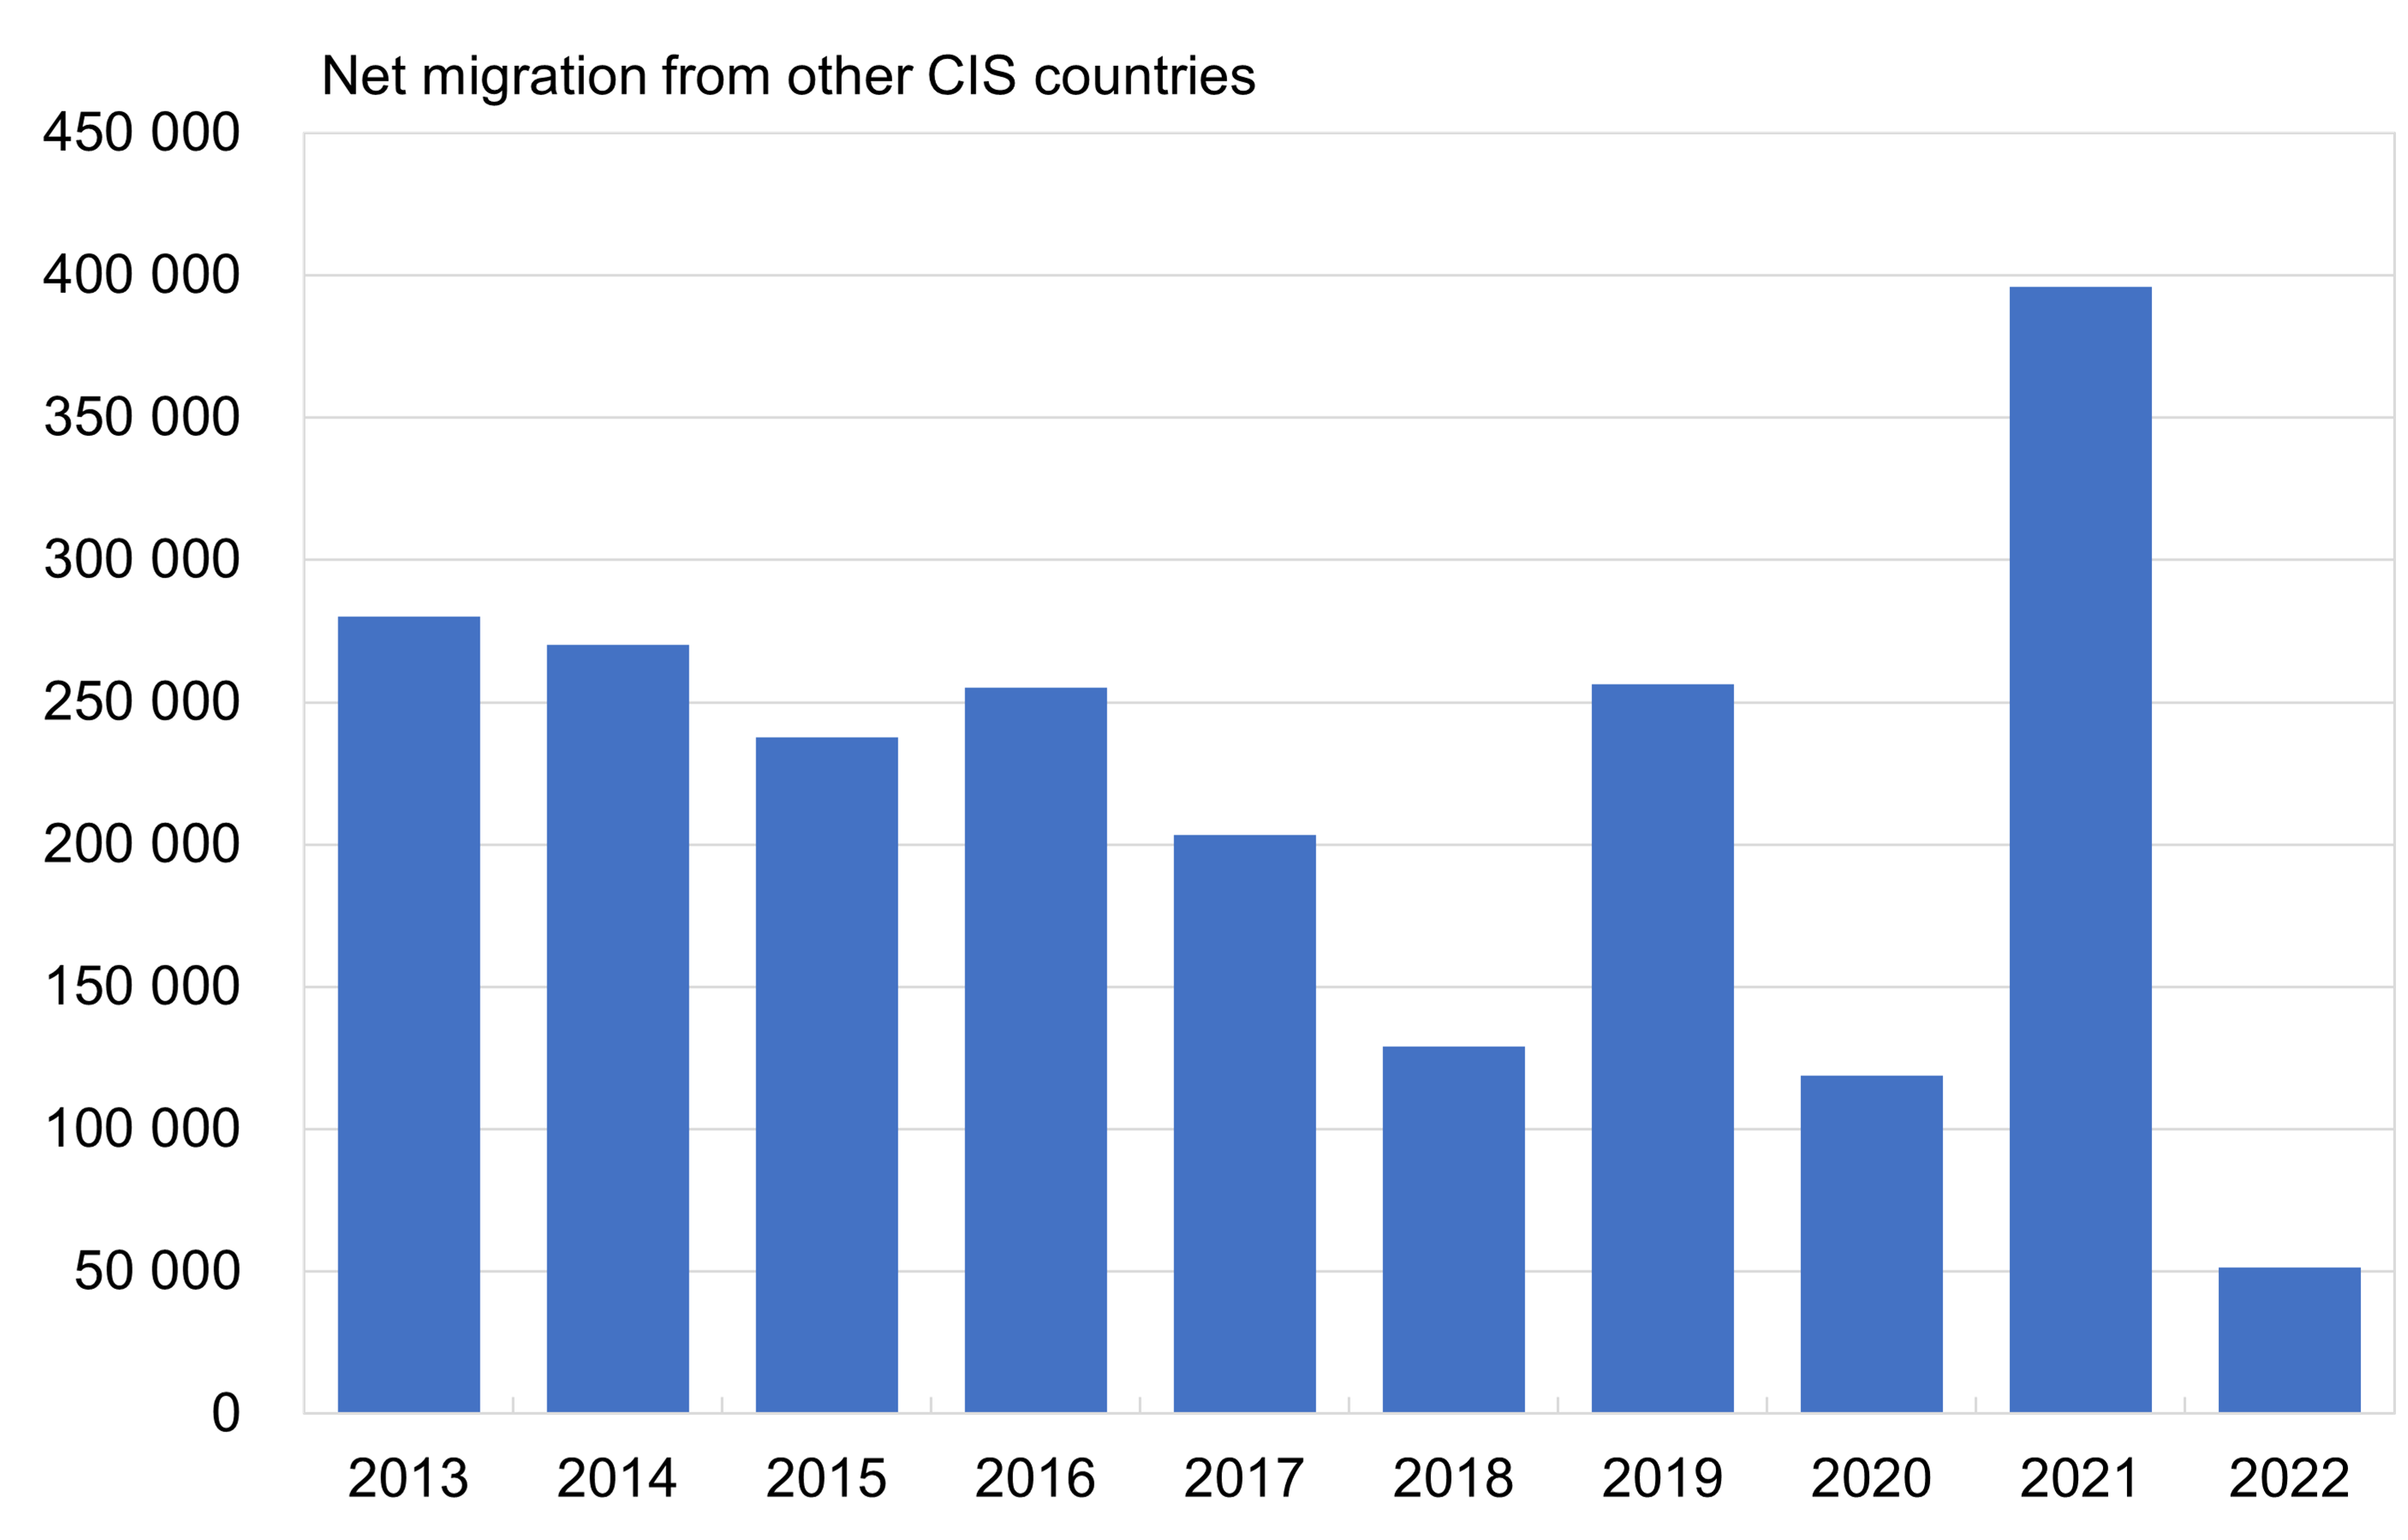
An important driver of Russia’s low unemployment rate is its shrinking working-age population. The fastest decline has been seen in the past decade in the cohort of Russians aged 20–40 years. The labour supply is also influenced by changing migration patterns. In recent decades, the Russian labour market experienced a fairly stable flow of fresh workers from Central Asia and Caucasus regions. Many of these migrant workers were employed in construction or low-paid jobs in the service sector. Last year just 650,000 people moved to Russia from CIS countries (mainly Central Asia), while 584,000 returned from Russia to CIS countries. Thus, the net migration to Russia from other CIS countries was only about 51,000 people, a much smaller number that in the first year of Covid-19 pandemic in 2020. The rise in emigration from Russia last year was caused by a combination of factors that included economic recession, uncertainty about the war, fears of being sent to the front and distinctly better economic conditions in the countries to which Russians were emigrating.
Russia’s migration statistics only tell part of the story. In particular, Russian citizens moving abroad do not always officially register as emigrees. Estimates as to the number of Russians who have permanently or temporarily left Russia since the invasion range between 500,000 and 800,000. The most popular destinations for Russian emigrees have been Kazakhstan, Armenia, Turkey and Georgia. Estimates of persons fleeing to Russia or Ukrainian nationals taken to Russia are all over the map. UN figures show that about 2.9 million Ukrainians crossed the border to Russia since the invasion. Many of these migrants continued their journey to third countries.
Net migration from other CIS countries to Russia was negligible last year
 Sources: Rosstat, CEIC, BOFIT.
The pace of job creation and destruction always varies somewhat from branch to branch, but the effects on Russian employment are fairly clear after a year of war. In the second half of 2022, the number of persons employed contracted in the trade and logistics branches. Correspondingly, over 300,000 new jobs were created in public administration (which includes defence). Despite the changes, trade, manufacturing and logistics remain the three branches with the most workers. They employed a total of 31 million people at the end of 2022, roughly 40 % of all jobs in Russia.
Change in number of people employed by branch in July-December 2022 (thousands)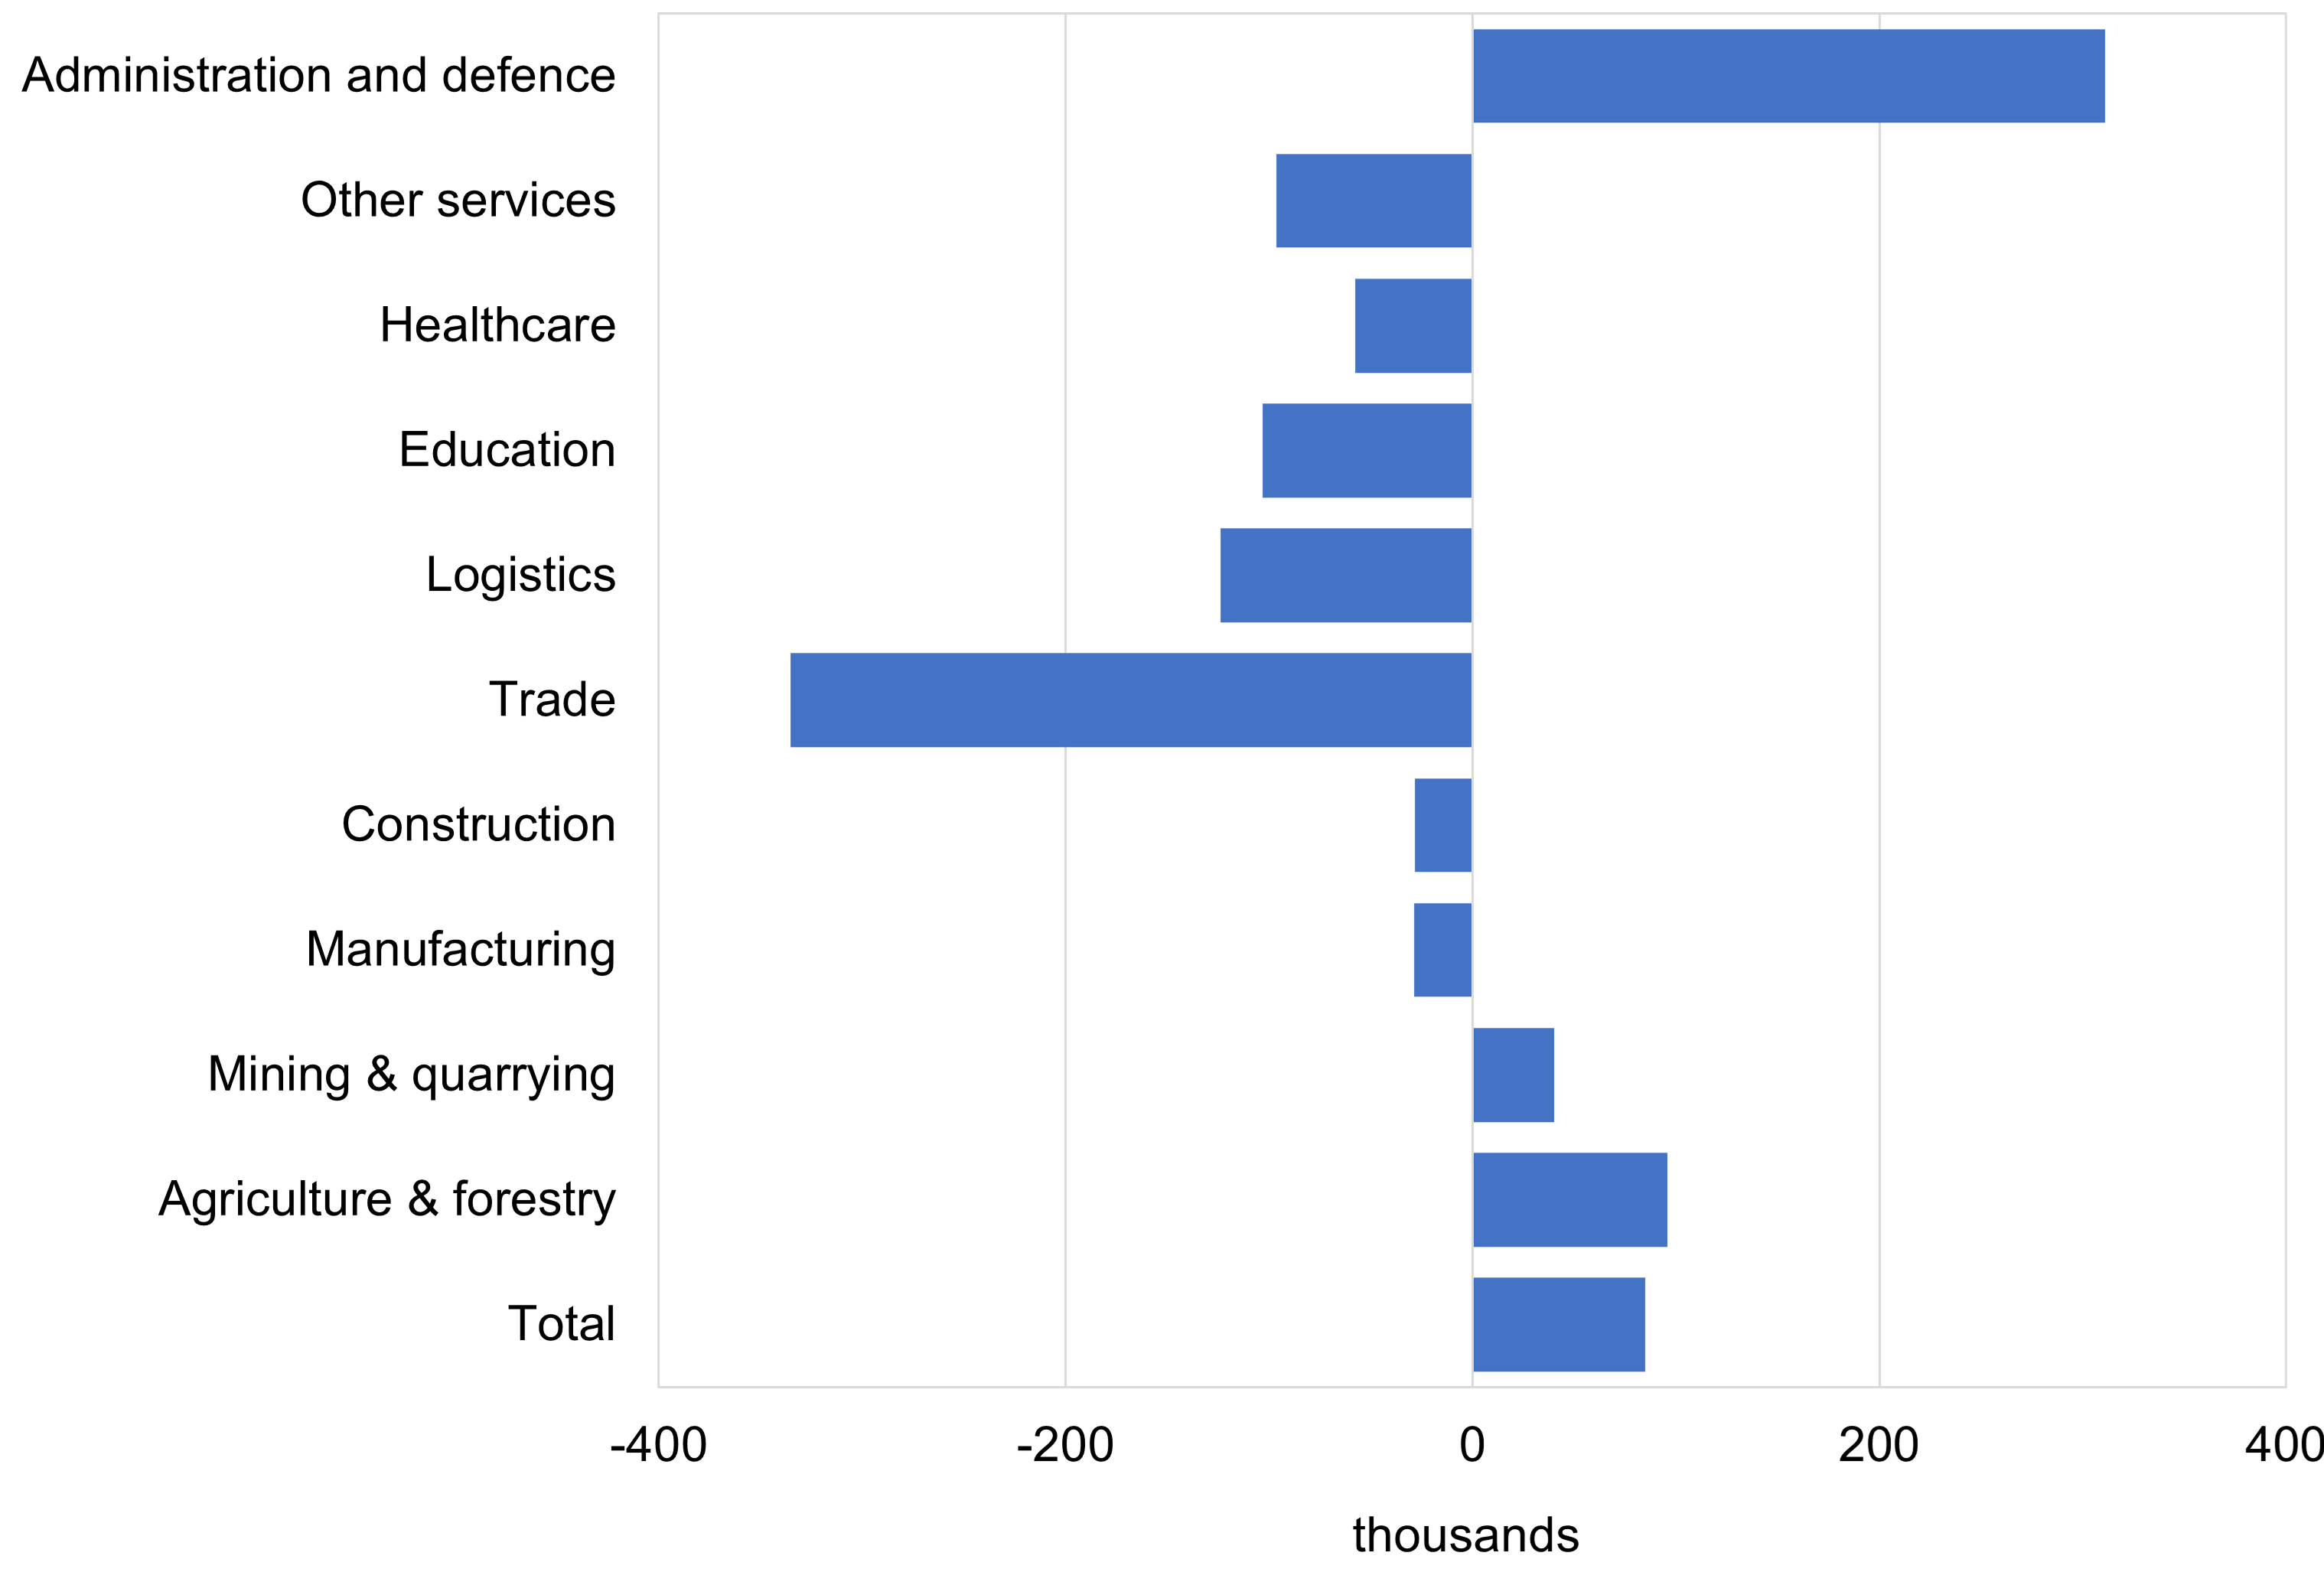
Sources: Rosstat, CEIC, BOFIT.
Seasonally-adjusted number of employed persons using the Tramo/Seats method.