BOFIT Viikkokatsaus / BOFIT Weekly Review 2021/06
In November 2020, on-year growth of the world goods trade returned to positive territory. Total trade volume grew by 1.5 % y-o-y. However, global trade developed weakly already before the covid-19 pandemic struck. Indeed, no overall growth in global trade occurred during 2018–2019. In November 2020, global export and import volumes achieved a level comparable to that at the end of 2017.
The volumes of exports and imports in China also limped along in the two years before the pandemic. In the second half of 2020, however, there was a major shift in Chinese trade. Exports volumes in November were up by more than 20 % y-o-y, along with a 2 % bump in imports. The growth reflects China’s swift repositioning to take on vast global demand for personal protective equipment such as masks and gowns, as well as technological products such as laptops and monitors as people around the world shifted to remote work, study and streamed content. In addition, demand for consumer goods such as furniture, toys and sporting goods revived globally, further boosting China’s export volumes. Indeed, China’s foreign trade almost single-handedly pulled global growth out of the covid hole last year. Recovery elsewhere in the world has been more modest. For example, export volumes in the euro area and the US in November were still down from twelve months previous.
While China’s export and import volumes rose, prices fell. As a result, the value of goods trade increased less than volumes. In dollar terms, China’s exports increased by 4 % in 2020, while imports contracted by nearly 1 %. China’s trade surplus grew to $535 billion, up from $420 billion in 2019. China increased its imports relatively more from neighbouring countries. In particular, the import shares of ASEAN countries and Taiwan rose last year. Import shares of the euro area and the US also grew in the second half. During 2020, African countries suffered the biggest loss in Chinese imports shares. With the exception of the US, export shares remained largely unchanged. The US share of Chinese exports surged at the end of the year after two years of contraction.
Assembly manufacturing continued to diminish last year, both as a share of exports and imports. It is worth noting that just a decade ago, assembly manufacturing represented half of all Chinese exports. Just two years ago, assembly production still represented roughly 35 % of exports. During the second half of 2020, the share of assembly production declined to about 30 % of exports. Domestic firms increasingly account for most of China’s exports. The export share of foreign-owned firms operating in China (including joint ventures with Chinese partners) peaked a couple years before the global financial crisis (about 60 % in 2006), and declined steadily ever since. At the end of 2020, foreign-owned firms accounted for about 35 % of exports.
China’s foreign trade last year clearly outperformed the world average
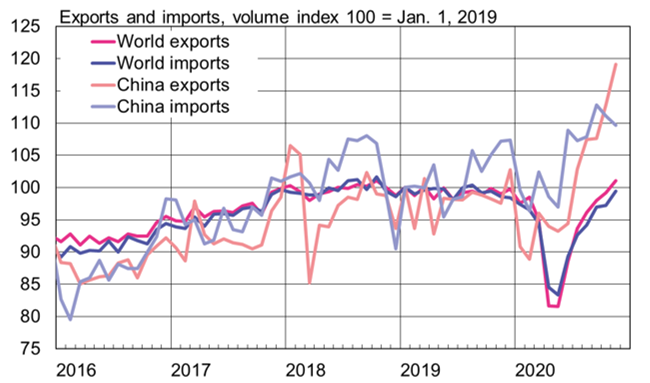
Sources: CPB World Trade Monitor and BOFIT.